Markets do not trade inside a laboratory.
They trade inside economies.
Economies grow, slow, inflate, tighten, recover, overheat, disappoint and occasionally send economists into television studios carrying charts large enough to qualify as furniture.
This creates two related ideas:
- economic cycles — broad changes in economic activity through time;
- market regimes — recurring combinations of growth, inflation, rates, liquidity and investor behavior that shape how markets respond.
What Are Market Regimes?
Market regimes are recurring combinations of economic and financial conditions that can shape how stocks, bonds, commodities, currencies and sectors behave. A regime might be described using variables such as economic growth, inflation, interest rates, liquidity, credit conditions, volatility and investor risk appetite.
Market regimes are related to economic cycles, but they are not the same thing. Economic cycles describe broad expansions and contractions in economic activity. Market regimes are analytical descriptions of the environment investors are pricing, which means markets can shift regimes before official economic data confirms a turning point.
A practical beginner framework is: Growth → Inflation → Rates → Financial conditions → Earnings expectations → Risk appetite → Market leadership. Regime analysis provides context; it does not create an automatic trading signal or eliminate company-specific analysis.
1. What Is an Economic Cycle?
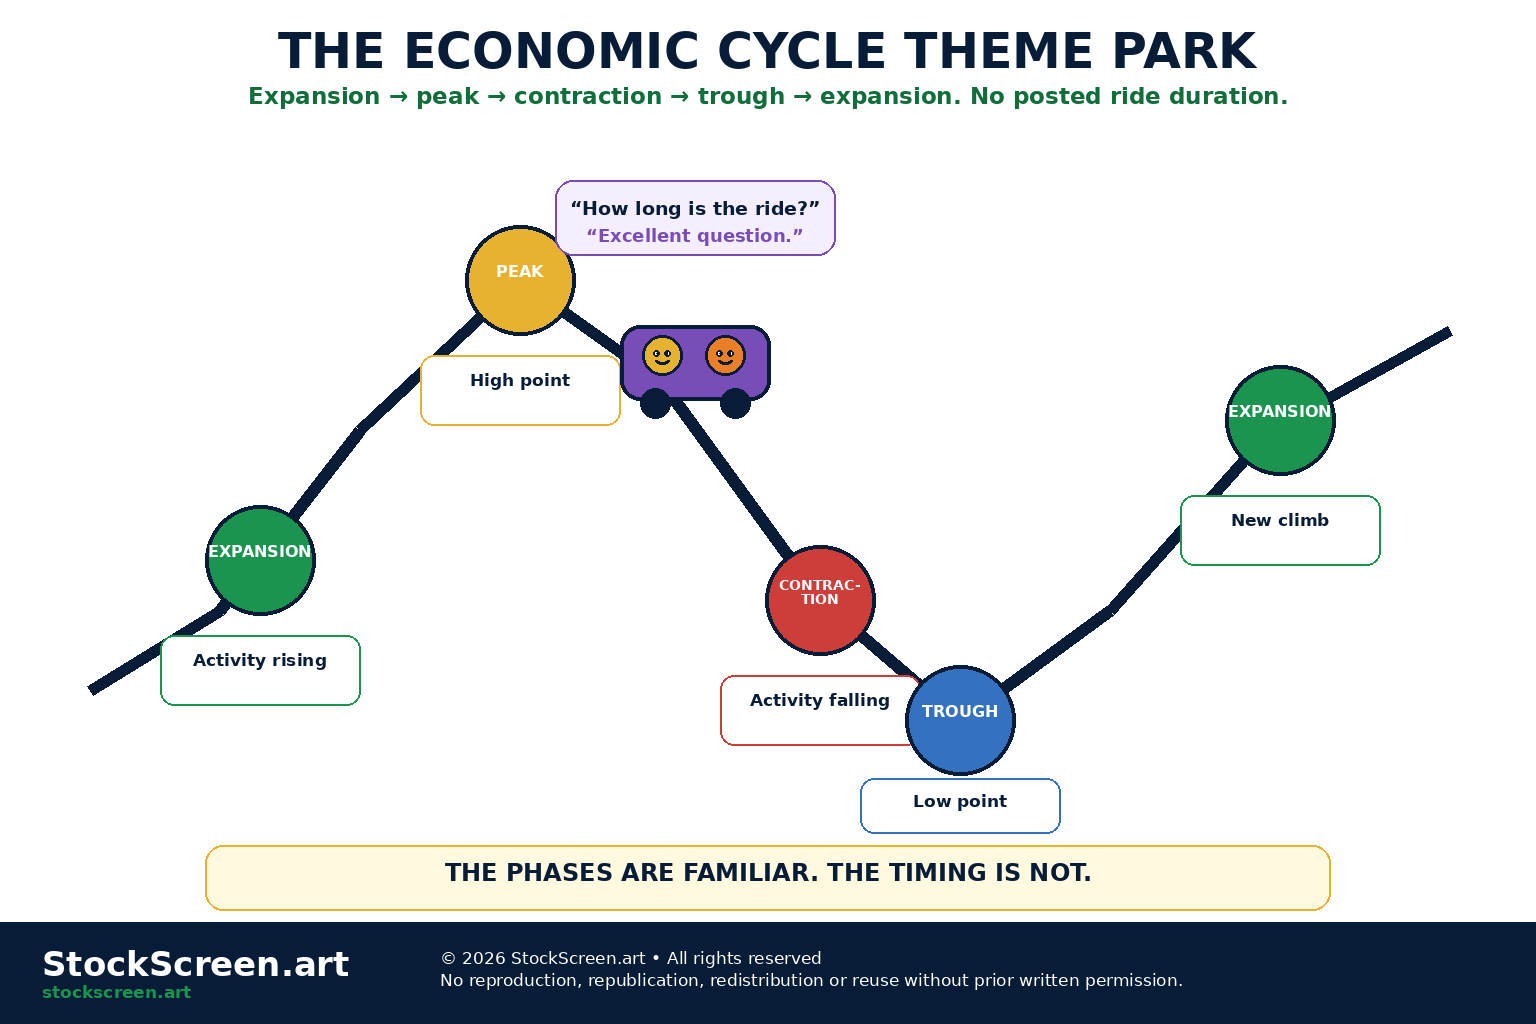
An economic cycle is the broad rise and fall of economic activity over time.
Economists often discuss:
- expansion;
- peak;
- contraction or recession;
- trough;
- renewed expansion.
This is a useful map.
It is not a train schedule.
2. Expansion
During an expansion, broad economic activity is generally rising.
Conditions may include:
- increasing production;
- growing employment;
- higher consumer spending;
- rising business investment;
- improving corporate earnings.
Not every industry expands at the same speed.
3. Peak
A peak marks the high point of an expansion before broad activity begins contracting.
Peaks are usually easier to identify after the fact.
Real-time investors do not receive a push notification reading:
ECONOMIC PEAK CONFIRMED. PLEASE ADJUST PORTFOLIO.
4. Contraction
A contraction is a period when broad economic activity declines.
In the United States, the National Bureau of Economic Research's Business Cycle Dating Committee maintains the widely used chronology of business-cycle peaks and troughs.
The NBER describes a recession as the period from a peak in economic activity to the subsequent trough.
5. A recession is not simply “two negative GDP quarters”
The popular rule of thumb:
“Two consecutive quarters of negative GDP = recession”
is not the formal NBER method for dating U.S. recessions.
The NBER evaluates a range of indicators reflecting economic activity.
Convenient slogans are convenient.
Economies are less cooperative.
6. Trough
A trough marks the low point of the contraction.
After the trough, economic activity enters a new expansion.
Importantly, the economy can still feel weak immediately after a trough.
“No longer contracting” and “everything is wonderful” are not synonyms.
7. Cycle phases are uneven
Expansions and contractions do not have fixed lengths.
One expansion can last years.
Another can be interrupted quickly.
Recessions can be:
- short and sharp;
- long and grinding;
- financially driven;
- policy driven;
- shock driven.
8. GDP: the broad activity scoreboard
Gross domestic product, or GDP, measures the value of goods and services produced in an economy.
The U.S. Bureau of Economic Analysis describes GDP as a comprehensive measure of the U.S. economy and its growth.
GDP is one of the most closely watched measures of broad economic activity.
9. Real GDP versus nominal GDP
Nominal GDP measures output using current prices.
Real GDP adjusts for price changes so analysts can focus more directly on changes in the quantity of economic output.
When discussing economic growth, real GDP is usually the more useful concept.
10. GDP is revised
Economic data is not carved into stone on release day.
BEA publishes multiple estimates for a quarter as more source data becomes available.
That means the number investors react to today can be revised later.
Macroeconomic analysis occasionally resembles solving a mystery while the clues are still being edited.
11. Employment
The labour market provides another important view of economic conditions.
Analysts watch measures such as:
- employment growth;
- unemployment;
- job openings;
- wage growth;
- hours worked.
Employment affects income, spending and confidence.
12. Employment can lag the cycle
Businesses may wait before hiring aggressively after conditions improve.
They may also wait before cutting workers when activity first slows.
This is one reason employment indicators can sometimes confirm changes after financial markets have already moved.
13. Inflation
Inflation describes a broad rise in the price level over time.
The Consumer Price Index, or CPI, is one widely followed measure.
The U.S. Bureau of Labor Statistics defines CPI as a measure of the average change over time in prices paid by urban consumers for a market basket of consumer goods and services.
14. Inflation is not “everything got more expensive by the same amount”
Price changes differ across categories.
Food can rise while gasoline falls.
Goods can behave differently from services.
Housing-related prices can move differently from electronics.
Inflation is an aggregate.
Your grocery receipt may have opinions.
15. Inflation level versus inflation rate
A slowing inflation rate does not necessarily mean prices are falling.
Example:
- Year 1 inflation = 6%;
- Year 2 inflation = 3%.
Prices are still rising in Year 2.
They are just rising more slowly.
This distinction is called disinflation.
16. Deflation
Deflation means a broad decline in the general price level.
It is different from disinflation.
Disinflation:
prices rising more slowly
Deflation:
prices broadly falling
17. Growth and Inflation: The Two Core Regime Axes
An economy can experience:
- strong growth with low inflation;
- strong growth with high inflation;
- weak growth with high inflation;
- weak growth with low inflation.
This gives us a useful way to think about market regimes.
18. What Is a Market Regime?
A market regime is a recurring pattern of economic and financial conditions that tends to influence:
- asset returns;
- volatility;
- sector leadership;
- credit conditions;
- investor risk appetite.
Unlike NBER business-cycle dates, there is no single universally mandated market-regime classification system.
19. Regime labels are analytical tools
One analyst may define regimes using:
- growth and inflation;
- growth and interest rates;
- volatility and trend;
- liquidity and credit spreads;
- statistical models.
Different frameworks can all be useful if their definitions are explicit.
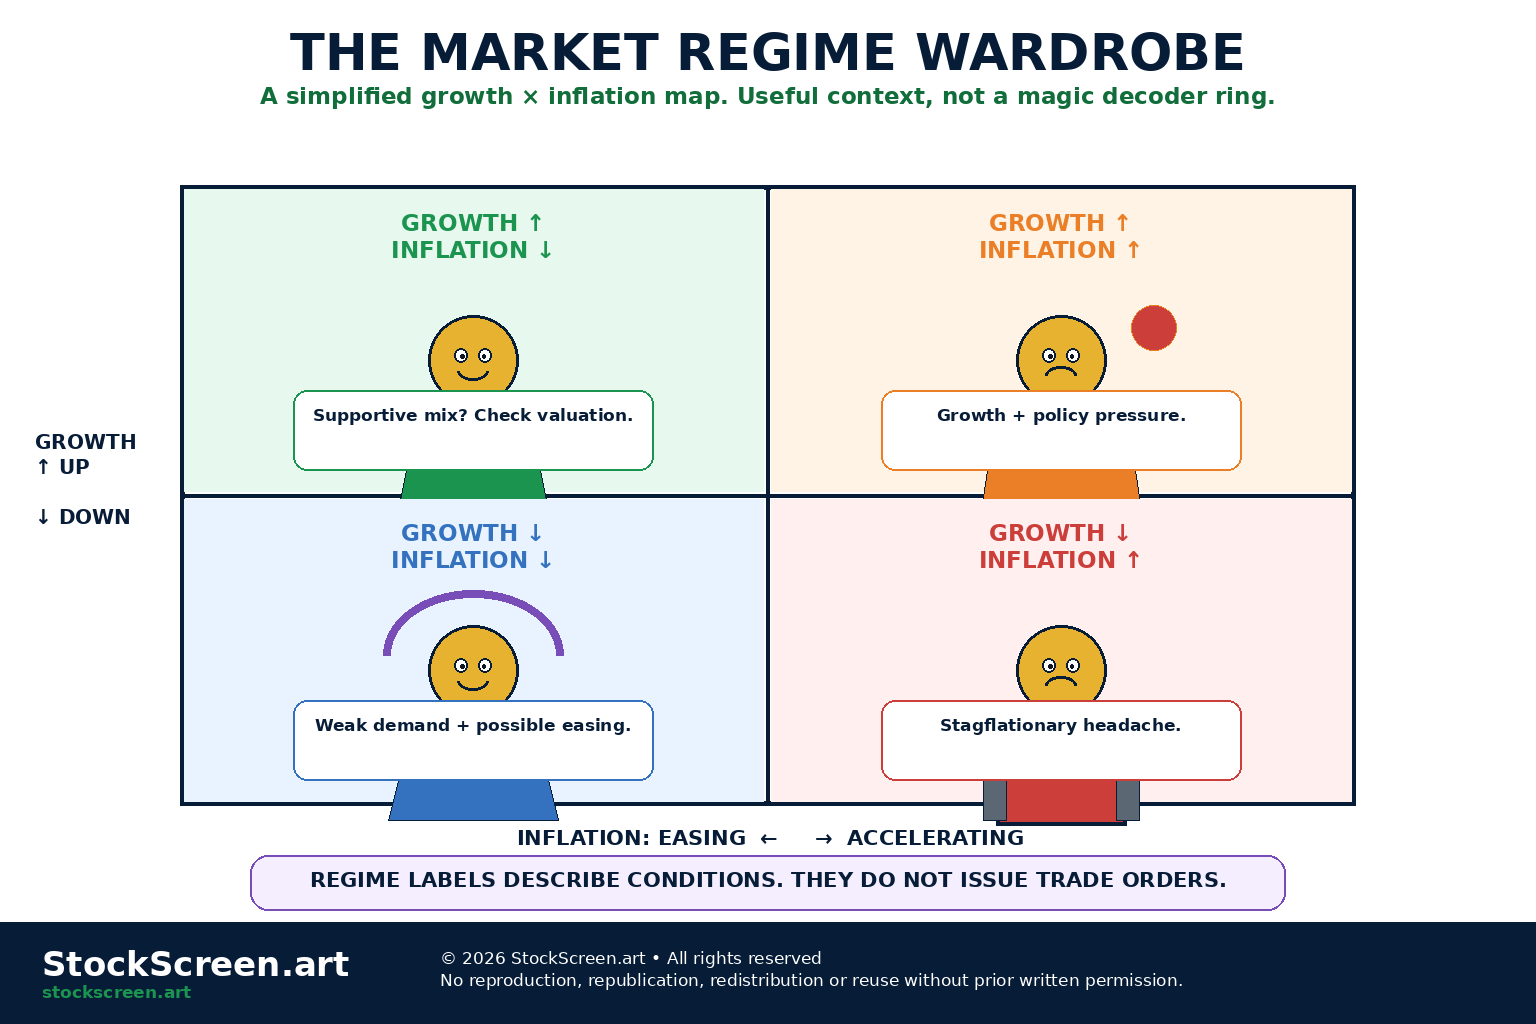
20. A Simple Growth-and-Inflation Market Regime Map
A common educational framework asks whether:
- growth is accelerating or decelerating;
- inflation is accelerating or decelerating.
This produces four simplified quadrants.
- Growth up / inflation down.
- Growth up / inflation up.
- Growth down / inflation up.
- Growth down / inflation down.
These are descriptions, not automatic trading signals.
21. Growth up, inflation down
This combination can be favourable for many risky assets because:
- economic activity is improving;
- inflation pressure is easing;
- policy may have more flexibility.
But valuation and starting conditions still matter.
A friendly regime cannot make an absurd price reasonable by executive order.
22. Growth up, inflation up
Strong growth can support company revenues and earnings.
Rising inflation can simultaneously create:
- higher input costs;
- tighter monetary policy expectations;
- higher bond yields;
- valuation pressure on long-duration assets.
The regime contains both tailwinds and headwinds.
23. Growth down, inflation up
Weakening growth plus persistent inflation is an uncomfortable combination.
It can reduce policy flexibility because supporting growth may conflict with controlling inflation.
Investors sometimes associate this environment with stagflationary risk.
The economy has chosen “hard mode.”
24. Growth down, inflation down
Slowing growth and easing inflation can appear during or after economic weakness.
Falling inflation may eventually give monetary policymakers more room to ease, but weak demand and earnings can still pressure businesses.
Again:
regime = context, not destiny
25. Growth level and growth direction are different
An economy can still be growing while growth is slowing.
Example:
- GDP growth falls from 4% to 2%.
Growth remains positive.
Momentum has weakened.
Markets often care about the change in direction, not merely whether the number is above zero.
26. Inflation level and inflation direction are different too
Inflation can remain high while falling.
Or remain low while rising.
Investors often react to:
- the level;
- the direction;
- the surprise relative to expectations.
Macroeconomics enjoys giving every number three jobs.
27. Expectations matter
Markets are forward-looking.
A weak economic report can coincide with rising stock prices if investors expected something even worse.
A strong report can coincide with falling stocks if it increases expectations for tighter monetary policy.
28. Good economy does not automatically mean good market
Suppose the economy is booming.
Investors may worry that:
- inflation will rise;
- rates will stay higher;
- profit margins will compress;
- valuations are already expensive.
Strong economic data can therefore be bad market news under some conditions.
29. Bad economy does not automatically mean bad market
Markets may rise during weak economic periods if investors expect:
- the downturn to end;
- policy easing;
- earnings recovery;
- improving liquidity.
Markets often attempt to price tomorrow while economic data describes yesterday.
30. Why Markets Can Lead the Economic Cycle
Stock prices incorporate expectations about future:
- earnings;
- rates;
- growth;
- risk.
Therefore equity markets can turn before official business-cycle dates are identified.
This does not mean markets predict every recession correctly.
They also occasionally predict recessions that fail to attend.
31. Leading indicators
Leading indicators are variables intended to provide information about future economic activity.
Examples analysts may watch include:
- new orders;
- building permits;
- credit conditions;
- yield-curve measures;
- business surveys;
- financial-market conditions.
No leading indicator has a perfect record.
32. Coincident indicators
Coincident indicators move broadly with current economic activity.
Examples can include measures of:
- employment;
- income;
- production;
- sales.
They help answer:
“What is the economy doing now?”
33. Lagging indicators
Lagging indicators often move after the broader cycle has already shifted.
They can help confirm trends rather than predict turning points.
Some labour-market and credit-loss measures can behave this way.
Lagging indicators are the friend who arrives after dinner but brings useful receipts.
34. Business surveys
Surveys of purchasing managers, manufacturers and service businesses can provide timely information about:
- orders;
- employment;
- prices;
- production;
- business sentiment.
Surveys are useful, but they are not identical to measured economic output.
35. Credit conditions
Economic activity depends partly on the availability and cost of credit.
Tightening credit can affect:
- business investment;
- housing;
- consumer borrowing;
- corporate refinancing;
- financial-sector risk.
Credit can quietly change the regime before GDP notices.
36. Financial conditions
Financial conditions broadly include factors such as:
- interest rates;
- credit spreads;
- equity prices;
- currency values;
- lending standards.
Easier conditions can support spending and investment.
Tighter conditions can restrain them.
37. Central banks influence the environment
The Federal Reserve explains that monetary policy influences short-term interest rates and broader financial conditions in pursuit of its mandated economic goals.
Central-bank decisions therefore matter for:
- borrowing costs;
- discount rates;
- currency values;
- credit availability;
- risk appetite.
We go much deeper into this in Central Banks and Interest Rates.
38. Interest rates are the bridge from macro to valuation
Rates can affect:
- corporate borrowing;
- consumer borrowing;
- housing affordability;
- bond yields;
- equity discount rates;
- currency relationships.
One macro variable can therefore appear in many asset-price conversations.
39. Earnings connect the economy to stocks
Stocks represent companies.
Companies sell products and services inside economies.
Economic growth can affect:
- revenue;
- volumes;
- pricing power;
- costs;
- credit losses;
- capital spending.
Macro conditions eventually show up in micro results.
40. Different companies have different economic sensitivity
Some businesses are highly cyclical.
Their demand can change significantly with the economy.
Others provide products or services whose demand is more stable.
Therefore:
same economic regime ≠ same company outcome
41. Cyclical businesses
Cyclical industries can include areas such as:
- autos;
- travel;
- industrial equipment;
- construction;
- some financial businesses;
- discretionary consumer spending.
Their results may be more sensitive to economic acceleration and slowdown.
42. Defensive businesses
Defensive sectors are commonly described as businesses whose demand may be relatively stable across the economic cycle.
Examples often include:
- utilities;
- consumer staples;
- parts of healthcare.
“Defensive” does not mean:
cannot fall
Valuation, debt, regulation and company-specific problems remain invited.
43. Inflation creates winners and losers differently
Inflation can help companies with:
- strong pricing power;
- real-asset exposure;
- revenues linked to nominal prices.
It can hurt companies with:
- fixed-price contracts;
- high input costs;
- weak pricing power;
- long-duration valuations.
Sector tendencies depend on details.
44. Commodity-sensitive sectors
Energy and materials companies can be strongly influenced by commodity prices.
A high-inflation regime driven by commodity shortages may affect them differently from a high-inflation regime driven mostly by services demand.
“Inflation” is not one identical shock.
45. Banks and interest-rate regimes
Financial companies can be affected by:
- interest-rate levels;
- yield-curve shape;
- loan growth;
- credit losses;
- deposit competition.
Saying “higher rates are good for banks” is too simple to be reliable.
46. Growth stocks and discount rates
Companies valued heavily on profits expected far in the future can be sensitive to changes in discount rates.
Higher rates can reduce the present value assigned to distant cash flows, all else equal.
But growth, margins, competitive advantage and starting valuation still matter.
47. Bonds respond to a different mix
Bond prices can respond to:
- interest-rate expectations;
- inflation expectations;
- credit risk;
- liquidity;
- maturity.
Government bonds and lower-quality corporate bonds may behave very differently in the same slowdown.
48. Commodities have their own cycle
Commodity prices depend on:
- supply;
- demand;
- inventories;
- weather;
- geopolitics;
- production capacity.
Economic growth matters, but the physical market can overpower the macro script. The Foundation lesson on commodity trading basics explains why oil, gold and wheat can respond to very different physical-market forces.
49. Currencies express relative regimes
A currency pair compares two economies. The Forex and Currency Pairs lesson explains how those relative economic views are expressed through exchange rates.
Investors may care about differences in:
- growth;
- inflation;
- interest rates;
- policy expectations;
- capital flows.
Forex remains committed to asking:
“Better than whom?”
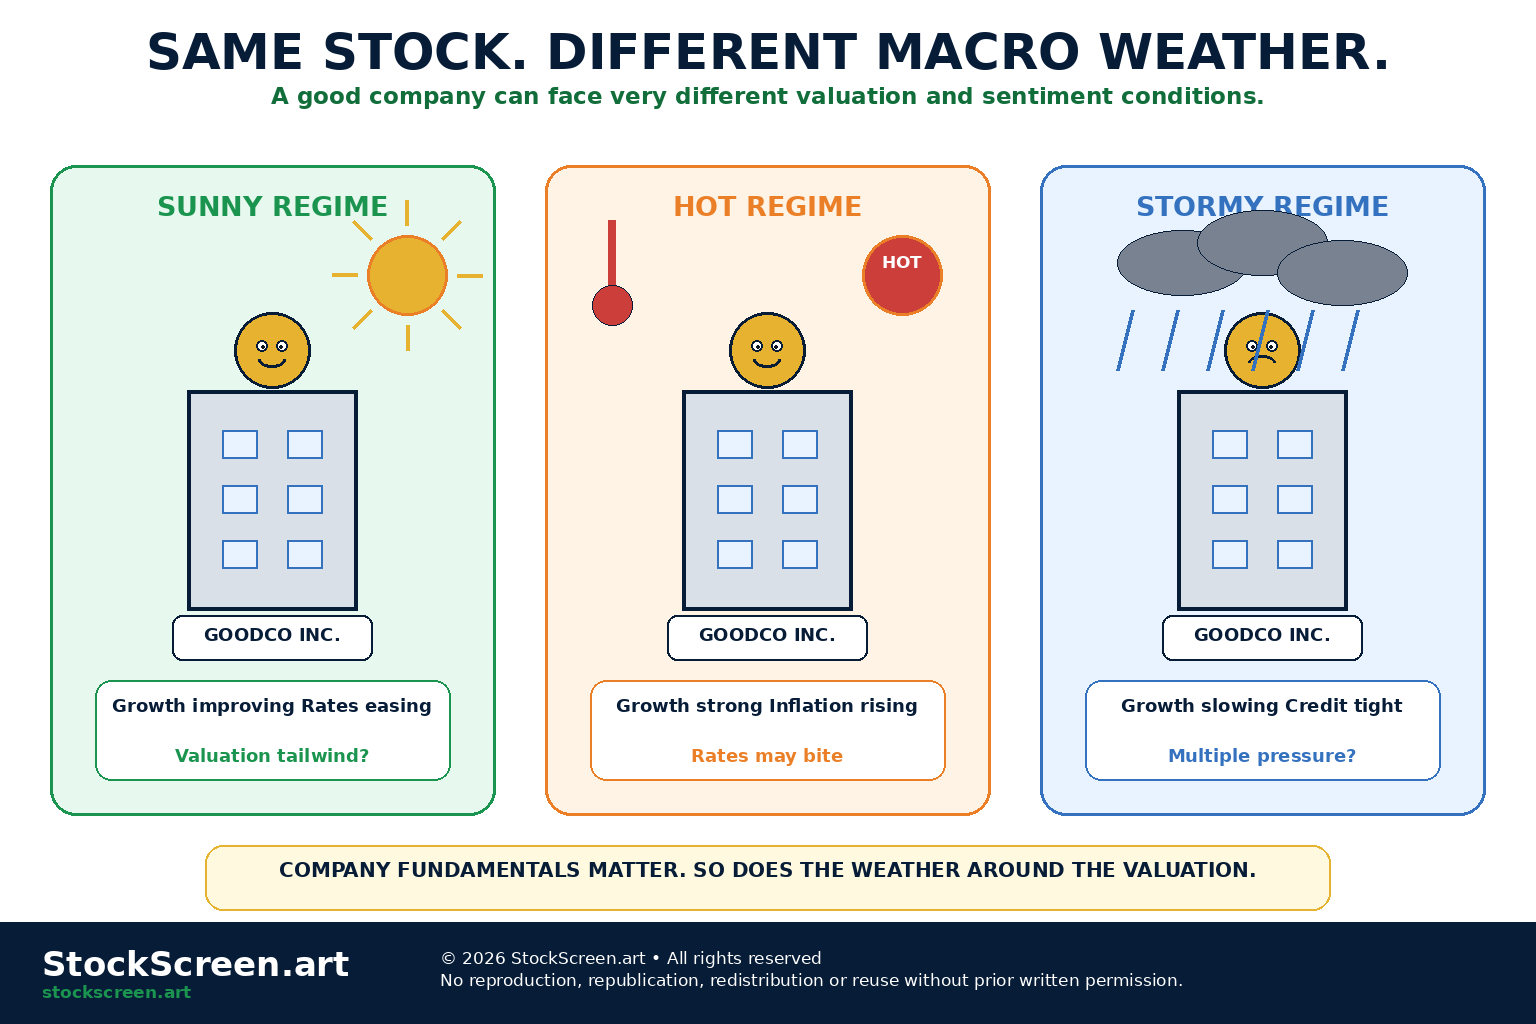
50. The same stock can trade differently in different regimes
Imagine the same fictional company:
- strong sales growth;
- healthy balance sheet;
- good management.
In one regime, falling rates and improving growth expectations may support a high valuation.
In another, rising rates and slowing growth may compress that valuation even if the company remains fundamentally sound.
51. Valuation changes can dominate earnings changes
A stock price can be simplified as:
fundamentals × valuation multiple
Not literally as one complete pricing formula, but as a useful mental model.
A company can grow earnings while its valuation multiple falls.
The stock can therefore disappoint even while the business improves.
52. Liquidity matters beyond economic growth
Markets can respond strongly to the availability of financing and investor liquidity.
A slowing economy with improving liquidity can create a different market environment from a slowing economy with tightening credit.
Growth alone does not define the regime.
53. Risk appetite
Investors alternate between:
- seeking return;
- protecting capital.
Risk appetite can affect:
- small versus large companies;
- lower- versus higher-quality credit;
- speculative versus defensive equities;
- emerging versus developed markets.
Sentiment can amplify fundamentals.
54. Why Market Regime Transitions Are Messy
A regime rarely sends a resignation letter before the next one starts.
Transitions can contain conflicting signals:
- growth slowing but jobs strong;
- inflation falling but wages firm;
- rates high but financial conditions easing;
- earnings weak but stocks rallying.
Mixed evidence is normal.
55. Market Regime Identification Is Probabilistic
Instead of saying:
“We are definitely in Regime 3.”
a more disciplined framing is:
“The evidence currently looks most consistent with slowing growth and easing inflation, but several indicators disagree.”
Uncertainty is not a defect in the analysis.
Pretending uncertainty does not exist is.
56. Data arrives at different speeds
Some data arrives:
- daily;
- weekly;
- monthly;
- quarterly.
Some data is revised.
Some is noisy.
Some is delayed.
Macro analysis is partly the art of assembling a puzzle whose pieces have different shipping dates.
57. One data point is not a regime
One strong jobs report does not prove acceleration.
One weak GDP quarter does not define a complete cycle.
One hot inflation print does not guarantee a new inflation regime.
Look for:
- direction;
- persistence;
- breadth;
- confirmation across indicators.
58. Surprise versus trend
Markets can react strongly to a single surprise even when the broader trend is unchanged.
Separate:
- today's surprise — what differed from expectations;
- the trend — what the broader sequence of data shows.
Both matter.
They answer different questions.
59. Regime models can disagree
A statistical regime model may identify one environment.
A discretionary macro analyst may identify another.
A growth-inflation framework may produce another label entirely.
The label matters less than the underlying variables and definitions.
60. Backtests can overfit regimes
It is easy to look backward and build a model that perfectly explains yesterday.
Problems arise when:
- regimes are defined using future information;
- too many variables are tuned;
- only successful historical relationships are kept;
- transaction costs are ignored.
History can become very cooperative after enough editing.
61. Regime analysis should not replace company analysis
Macro conditions can explain part of a stock's environment.
They do not replace:
- balance-sheet analysis;
- competitive positioning;
- valuation;
- earnings quality;
- management;
- industry structure.
A hurricane does not make every house identical.
62. Regime analysis should not replace risk management
Even a correct regime call can produce poor investment results if:
- the security is overvalued;
- position size is excessive;
- the trade is crowded;
- the timing is wrong;
- the regime changes.
Context improves decisions.
It does not abolish uncertainty.
63. A Practical Economic-Cycle Dashboard
A beginner-friendly dashboard might watch:
- Real economic growth.
- Employment conditions.
- Inflation trend.
- Business surveys.
- Credit conditions.
- Interest rates.
- Yield-curve signals.
- Corporate earnings expectations.
The objective is not to create the cockpit of a commercial aircraft.
Eight useful gauges beat eighty blinking ones you do not understand.
64. A Practical Market Regime Checklist
- Is growth accelerating or decelerating?
- Is inflation accelerating or decelerating?
- Are financial conditions tightening or easing?
- What is happening to rates?
- Are earnings expectations rising or falling?
- Is credit stress increasing?
- Which sectors are showing relative strength?
- What is already priced into markets?
- Which evidence contradicts the current regime label?
65. Seven terrible macro conclusions
- “GDP was negative once. Recession confirmed.”
- “Inflation fell, therefore prices are falling.”
- “The economy is strong, therefore stocks must rise.”
- “The economy is weak, therefore stocks must fall.”
- “Rates fell, therefore every growth stock is automatically cheap.”
- “This sector usually likes this regime, so company fundamentals are optional.”
- “My regime model has four colours. Uncertainty has been defeated.”
66. Ten mental models worth keeping
- Economic cycle and market regime are related but different.
- Peaks and troughs define the formal U.S. business-cycle chronology.
- No single data point describes the whole economy.
- Markets price expectations, not just current data.
- Growth level and growth direction are different.
- Inflation level and inflation direction are different.
- Rates and financial conditions transmit macro changes into asset prices.
- Sector tendencies are conditional, not guaranteed.
- Regime transitions are messy and probabilistic.
- Use macro context to improve analysis—not to replace security selection or risk control.
Market Regime Questions
What is a market regime?
A market regime is an analytical description of recurring economic and financial conditions that influence asset prices, volatility, sector leadership, credit conditions and investor risk appetite. Common regime inputs include growth, inflation, interest rates, liquidity and financial conditions.
What is the difference between an economic cycle and a market regime?
An economic cycle describes broad changes in economic activity, such as expansion, peak, contraction and trough. A market regime describes the environment investors are currently pricing and can change before an official economic turning point is identified.
How do growth and inflation define market regimes?
A simple framework looks at whether growth and inflation are accelerating or decelerating. That creates four broad combinations: growth up/inflation down, growth up/inflation up, growth down/inflation up and growth down/inflation down. These are descriptive contexts, not automatic trading rules.
Why can stocks rise when the economy looks weak?
Markets are forward-looking. Weak current data may already be priced in, or investors may expect easier policy, improving liquidity, a future earnings recovery or an approaching economic trough.
Can a market regime model predict which sectors will outperform?
Not reliably by itself. Sector tendencies can change with valuation, positioning, policy, company fundamentals and the exact cause of the regime. Regime analysis is most useful as context rather than as a deterministic forecast.
Quick knowledge check
Ten questions. Economists have not yet revised the answer key.
1. What is the difference between an economic cycle and a market regime?
An economic cycle describes broad changes in economic activity through expansions and contractions. A market regime is an analytical description of recurring combinations of macro and financial conditions such as growth, inflation, rates, liquidity and risk appetite.
2. Does the NBER define a U.S. recession simply as two consecutive quarters of negative GDP?
No. The NBER Business Cycle Dating Committee identifies peaks and troughs using a range of indicators of economic activity.
3. What is real GDP?
GDP adjusted for price changes so analysts can focus more directly on changes in economic output rather than changes caused only by prices.
4. If inflation falls from 6% to 3%, are prices generally falling?
Not necessarily. Prices are still rising if inflation remains positive; they are simply rising more slowly. That is disinflation.
5. Why can stock prices rise during weak economic data?
Markets are forward-looking. Investors may have expected worse data or may anticipate future policy easing, improving growth or recovering earnings.
6. What is a leading indicator?
An indicator used in an attempt to provide information about future economic activity before the broader cycle is fully visible.
7. What does “growth down” mean in a regime framework?
Growth momentum is decelerating. It does not necessarily mean economic growth is already negative.
8. Why can the same company trade differently in two macro regimes?
Interest rates, valuation multiples, earnings expectations, liquidity and investor risk appetite can change even if the underlying company remains fundamentally similar.
9. Are sector-regime relationships guaranteed?
No. They are conditional tendencies influenced by valuation, company fundamentals, policy, positioning and the exact cause of the regime.
10. What is the main purpose of regime analysis?
To provide economic and market context for investment analysis so investors can understand which broad forces may be helping or hurting securities and portfolios.
Where we go next
We now have the macro weather map.
Next we meet the institution that spends an extraordinary amount of time discussing the thermostat.
FND-RW-02 — Central Banks and Interest Rates.
We will look at policy rates, financial conditions, inflation, employment and why one sentence from a central-bank statement can cause several trillion dollars of market value to reconsider its afternoon plans.
Primary sources & further reading
- National Bureau of Economic Research — U.S. Business Cycle Expansions and Contractions
- National Bureau of Economic Research — Business Cycle Dating
- U.S. Bureau of Economic Analysis — Gross Domestic Product
- U.S. Bureau of Economic Analysis — What to Know About GDP
- U.S. Bureau of Labor Statistics — Consumer Price Index
- Federal Reserve — Monetary Policy