At 8:29:59 a.m., markets have one set of expectations.
At 8:30:01 a.m., a government statistical agency publishes a number.
Within seconds:
- bond yields jump;
- currencies move;
- stock-index futures reverse;
- financial television discovers six urgent adjectives.
The number itself may have changed by only a tenth of a percentage point.
So what happened?
How Do Economic Data Releases Affect the Stock Market?
Economic data releases affect the stock market by changing investor expectations about growth, inflation, interest rates, earnings and monetary policy. The market reaction depends not only on the headline number, but on how the actual result compares with what investors expected beforehand.
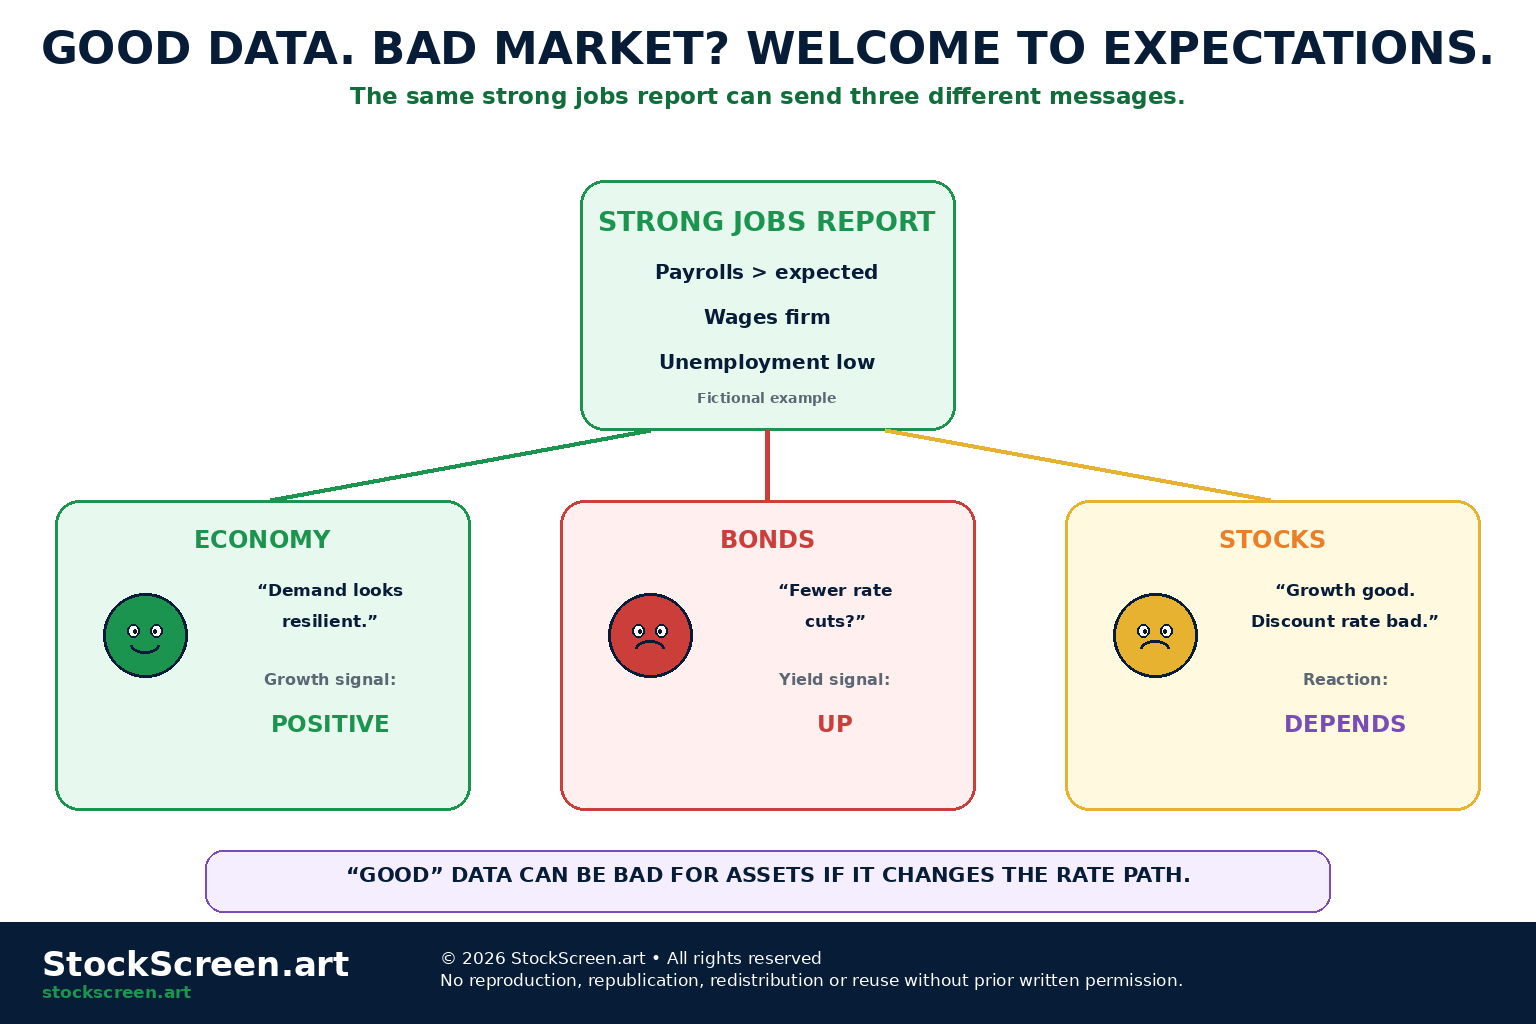
That is why a strong economic report can sometimes make stocks fall, while a weak report can sometimes make them rise. If strong data increases expectations for higher interest rates, valuation pressure can outweigh the positive growth signal. If weak data increases expectations for easier policy without creating severe recession fears, markets may react positively.
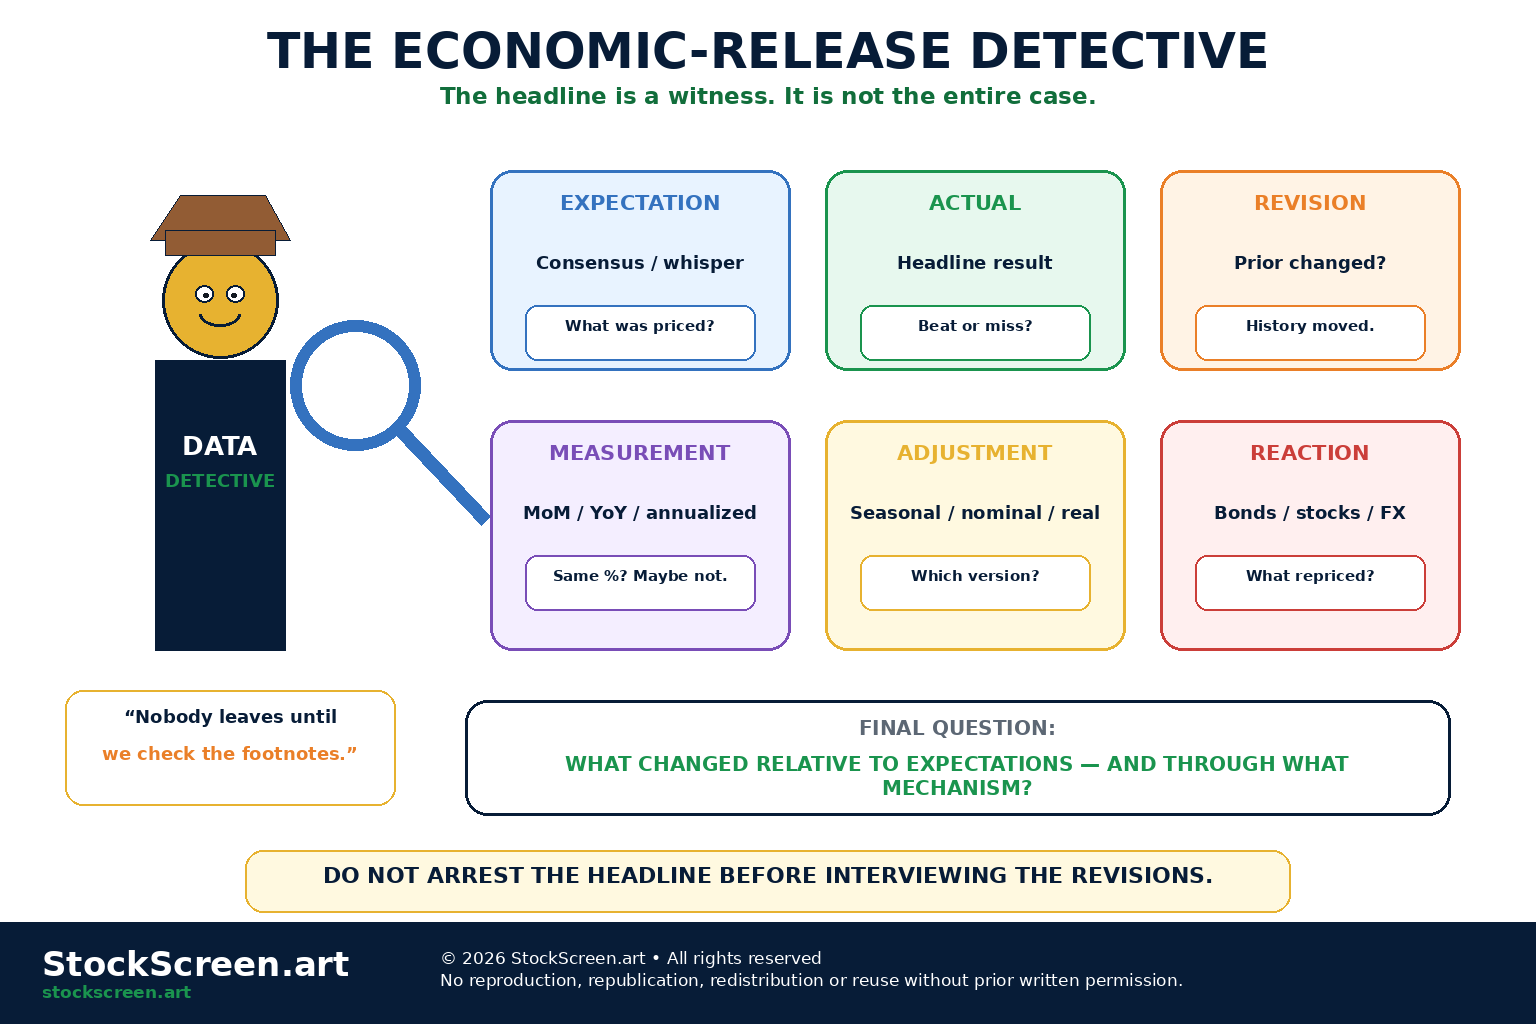
A useful release-day framework is: Consensus → Actual → Revisions → Key components → Growth / inflation implication → Policy implication → Bond reaction → Stock reaction → Currency reaction. The headline is only the first line of the analysis.

1. What Are Scheduled Economic Data Releases?
Many important economic statistics are published on known schedules.
Examples include:
- Consumer Price Index;
- Employment Situation;
- Producer Price Index;
- Gross Domestic Product;
- Personal Income and Outlays;
- Retail Sales.
Official agencies publish calendars showing release dates and times.
2. Why Economic Releases Can Surprise Markets
The release time may be known.
The number is not.
Before the release, economists and market participants form estimates.
Prices begin reflecting those expectations.
The surprise arrives when reality disagrees with the estimate.
3. Consensus expectation
A consensus expectation is a summary of forecasts collected from economists or market participants.
Different data services may calculate consensus differently.
The exact median forecast is less important here than the concept:
the market had an expectation before the number arrived
4. Actual result
The actual is the number published in the release.
Example:
- consensus monthly CPI = +0.2%;
- actual monthly CPI = +0.4%.
That is an upside inflation surprise.
5. Prior result
Economic calendars also show the prior result.
This tells us what the previous period originally showed.
But prior data can be revised.
Therefore the market may receive two pieces of news:
- the new month;
- a changed history lesson.
6. Revisions matter
Suppose payroll growth is reported at:
+180,000
against a:
+170,000 consensus
Headline:
jobs beat expectations
But suppose the prior two months are revised down by a combined 120,000 jobs.
The overall labour-market message may be weaker than the headline beat suggests.
7. The Three-Number Rule: Actual, Consensus and Prior
Before interpreting a major release, record:
- Actual.
- Consensus.
- Prior, including revisions.
If you read only actual, you are reading one-third of the scoreboard.
8. Surprise direction
A surprise can be:
- above expectation;
- below expectation;
- roughly in line.
But “above” is not automatically good.
A higher-than-expected inflation number is usually not celebrated with cake.
9. Why Good Economic News Can Be Bad for Stocks
A strong economy can support:
- revenue;
- earnings;
- employment;
- credit quality.
But stronger growth can also increase:
- inflation pressure;
- expected policy rates;
- bond yields;
- discount rates.
Good economy and good market are related concepts.
They are not legally married.
10. Why Weak Economic Data Can Sometimes Lift Stocks
Weak data can sometimes support markets if investors conclude:
- inflation pressure is easing;
- central-bank tightening is less likely;
- rate cuts may arrive sooner.
But if weakness becomes severe, recession and earnings fears can dominate.
11. The market reaction depends on the regime
In an inflation-dominated regime, investors may focus heavily on:
- CPI;
- PCE inflation;
- wages;
- inflation expectations.
In a recession-dominated regime, investors may focus more on:
- payroll growth;
- unemployment;
- retail spending;
- credit stress;
- business activity.
12. Same release, different regime, different reaction
Strong payroll growth can mean:
“Excellent. The economy is resilient.”
in one environment.
The same result can mean:
“Excellent. Rates are staying high forever.”
in another.
Markets are not inconsistent merely because the regime changed. The Economic Cycles and Market Regimes lesson explains why the same release can matter differently in different macro environments.
13. CPI
The Bureau of Labor Statistics Consumer Price Index measures changes over time in prices paid by urban consumers for a market basket of goods and services.
CPI is one of the most closely watched U.S. inflation releases.
14. Headline CPI
Headline CPI includes the broad basket.
It includes categories such as:
- food;
- energy;
- shelter;
- medical care;
- transportation;
- recreation.
Consumers cannot exclude food and energy from the grocery receipt simply because an economist prefers the core series.
15. Core CPI
Market commentary often focuses on CPI excluding food and energy, commonly called core CPI.
Food and energy can be volatile.
Removing them can help analysts study underlying inflation persistence.
Core does not mean:
everything important
16. Month-over-month CPI
A monthly CPI change asks:
how much did the index change from last month?
Market participants often study the seasonally adjusted monthly change because it provides more timely information about current momentum.
17. Year-over-year CPI
A twelve-month change asks:
how much higher is the index than twelve months ago?
BLS commonly presents twelve-month CPI changes using not-seasonally-adjusted indexes.
Monthly and yearly rates can tell different stories.
18. Monthly inflation can cool while yearly inflation rises
This can happen because the year-over-year number depends on:
- the newest month entering the calculation;
- the month from one year earlier dropping out.
Welcome to base effects.
19. Base effects
Imagine last year's comparison month had unusually low inflation.
When that low month leaves the twelve-month window, the year-over-year rate can rise even if the newest monthly reading is not especially hot.
The denominator has opinions.
20. Monthly inflation can rise while yearly inflation falls
The opposite can happen if a very high inflation month from a year earlier drops out of the twelve-month comparison.
Therefore always separate:
- current monthly momentum;
- year-over-year level.
21. Seasonally adjusted data
Many economic series have predictable seasonal patterns.
Examples:
- holiday shopping;
- school schedules;
- winter heating;
- summer travel;
- seasonal hiring.
Seasonal adjustment attempts to remove recurring seasonal effects so underlying changes are easier to compare across periods.
22. Seasonal adjustment is statistical processing
BLS publishes both seasonally adjusted and unadjusted CPI data.
Seasonal factors can be updated, and some seasonally adjusted history can therefore be revised.
This is normal statistical maintenance.
23. Do not mix adjusted and unadjusted numbers casually
A month-over-month seasonally adjusted CPI change and a twelve-month unadjusted CPI change can both be valid.
But they answer different questions.
Label your measurement before comparing it.
24. PPI
The Producer Price Index is a family of indexes measuring average changes over time in selling prices received by domestic producers.
BLS emphasizes the perspective:
seller
CPI focuses on prices paid by consumers.
PPI focuses on prices received by producers.
25. PPI is not “future CPI” with a calendar attached
Producer-price changes can eventually affect consumer prices.
But pass-through depends on:
- margins;
- contracts;
- pricing power;
- product mix;
- distribution costs;
- demand.
PPI can contain useful pipeline information.
It is not a CPI preview service.
26. PCE price index
The Bureau of Economic Analysis publishes the Personal Consumption Expenditures price index as part of Personal Income and Outlays.
It measures changes in prices of goods and services purchased by consumers in the United States.
The Federal Reserve uses PCE inflation in its inflation framework.
27. CPI and PCE are not identical
Differences can arise from:
- coverage;
- weights;
- formula construction;
- how categories such as medical spending are treated.
Therefore:
CPI inflation ≠ PCE inflation
even though both measure consumer-price inflation.
28. Core PCE
Market participants also follow PCE excluding food and energy.
It provides another view of underlying inflation.
Again:
no single inflation number deserves custody of the entire macro forecast.
29. How Inflation Surprises Affect Bond Yields
A hotter-than-expected inflation release can cause investors to expect:
- higher policy rates;
- later rate cuts;
- higher real rates;
- more inflation risk.
Treasury yields can rise, especially at maturities sensitive to policy expectations. The Central Banks and Interest Rates lesson explains how changing policy expectations transmit into broader financial conditions.
30. How CPI and Inflation Surprises Affect Stocks
Higher yields can pressure equities through:
- higher discount rates;
- higher borrowing costs;
- lower valuation multiples.
But if hotter inflation accompanies strong growth, some cyclical earnings expectations may improve.
One release can pull different valuation levers at once.
31. Inflation surprises and currencies
If hotter inflation causes markets to expect tighter monetary policy, the domestic currency can strengthen under some conditions.
But currencies depend on relative policy expectations.
Hot U.S. CPI matters differently if foreign inflation surprises even more.
32. Employment Situation
The BLS Employment Situation combines information from two major surveys:
- the Current Population Survey, often called the household survey;
- the Current Employment Statistics survey, often called the establishment or payroll survey.
They measure different concepts.
33. Household survey
The household survey provides information on:
- labour-force participation;
- employment;
- unemployment;
- demographic characteristics.
Its unit is fundamentally people and their labour-force status.
34. Establishment survey
The establishment survey provides information on:
- nonfarm payroll employment;
- hours;
- earnings;
- industry employment.
Its unit is payroll jobs at establishments.
35. People are not jobs
One person can hold multiple jobs.
Some self-employed workers are captured differently.
Agriculture and private household employment are treated differently across the surveys.
Therefore the two employment measures need not match month to month.
36. Nonfarm payrolls
The monthly change in nonfarm payroll employment is one of the most watched labour-market numbers.
A stronger-than-expected payroll result can signal:
- resilient labour demand;
- stronger household income;
- potential wage pressure.
Again:
whether markets like that depends on the inflation and policy regime.
37. Unemployment rate
The unemployment rate comes from the household survey.
Simplified:
Unemployment Rate = Unemployed ÷ Labour Force
The labour force includes employed people plus people classified as unemployed and actively seeking work under survey definitions.
38. Participation rate
The labour-force participation rate helps explain changes in unemployment.
The unemployment rate can rise because:
- people lose jobs;
- more people enter the labour force and begin looking for work;
- some combination of both.
Same unemployment-rate move.
Different story underneath.
39. Average hourly earnings
Wage measures matter because compensation affects:
- household income;
- consumer demand;
- business labour costs;
- inflation pressure.
A strong payroll number plus rapid wage growth can be interpreted differently from strong payrolls with easing wage growth.
40. Average weekly hours
Employers can adjust labour demand through:
- headcount;
- hours.
Changes in average weekly hours can therefore add context to payroll numbers.
Before firing the worker, a company may reduce the schedule.
41. Payroll revisions
Initial payroll estimates are revised as more survey responses arrive.
BLS also conducts annual benchmarking using more comprehensive employment records.
Revisions are not unusual.
Early estimates trade completeness for speed.
42. Why Jobs-Report Revisions Can Move Markets
A current-month payroll beat can lose significance if:
- previous months are sharply revised down;
- wages are weaker;
- hours fall;
- unemployment rises.
Jobs day is a package deal.
43. How Markets Interpret the Jobs Report
Fictional release:
- payrolls: stronger than expected;
- unemployment: higher;
- wages: softer;
- prior payrolls: revised lower.
Is the report strong or weak?
Correct answer:
“Which part is the market currently pricing most aggressively?”
44. GDP
Gross domestic product measures the value of final goods and services produced in the economy.
BEA publishes GDP on a quarterly basis.
Real GDP adjusts for price changes.
45. Advance GDP estimate
The advance estimate is the first official estimate for a quarter.
It arrives quickly, before every underlying source dataset is complete.
Speed is the feature.
Incompleteness is the price.
46. Second GDP estimate
BEA later publishes a second estimate using more complete source data.
The growth rate and components can be revised.
47. Third GDP estimate
A third estimate follows with still more complete information.
Later annual or comprehensive revisions can also update history.
GDP has sequels.
Unlike many sequels, the later versions often contain more data.
48. GDP revisions are normal
Revision does not mean the first estimate was fraudulent.
It means:
- new source data arrived;
- seasonal factors changed;
- components were updated.
Economic statistics are estimates built from evolving information.
49. Annualized GDP rates
U.S. quarterly GDP growth is commonly reported at an annualized rate.
This asks approximately:
what annual rate would result if this quarter's pace continued for a full year?
It is not the same as the economy literally growing that percentage from one quarter to the next.
50. Annualized versus year-over-year growth
A quarterly annualized growth rate and a year-over-year GDP growth rate are different calculations.
Always check:
- comparison period;
- annualization;
- real versus nominal.
Percentage signs are friendly.
Their denominators are not.
51. GDP components
A common expenditure identity is:
GDP = Consumption + Investment + Government + Exports − Imports
A headline GDP beat can come from different components.
Composition matters.
52. Inventories can distort the headline story
Inventory investment can add or subtract from GDP growth.
A large inventory contribution may not represent strong final demand.
Investors often look beneath the headline to understand the source of growth.
53. Imports subtract in GDP accounting
Imports are subtracted in the expenditure identity because imported goods are included inside other spending categories but are not domestic production.
This does not mean:
imports are economically bad
It is an accounting adjustment.
54. Retail sales
The Census Bureau Advance Monthly Retail Trade Survey provides an early indication of sales at retail and food-service establishments.
Retail sales are widely used as a measure of consumer demand for goods and food services.
55. Retail-sales headline is nominal
Census states that advance retail-sales estimates are adjusted for seasonal variation and calendar effects but are not adjusted for price changes.
That means higher prices can lift nominal sales even if physical quantities do not rise.
56. Inflation can make retail sales look stronger
Suppose:
- units sold = unchanged;
- average prices = +5%.
Nominal sales can rise roughly 5%.
The cash register got busier.
The shopping cart did not.
57. Retail sales are revised too
Advance estimates use incomplete early data.
Later reports can revise previous estimates.
Again:
timely data is often less complete data
58. Personal Income and Outlays
BEA's Personal Income and Outlays release includes:
- personal income;
- disposable personal income;
- personal consumption expenditures;
- PCE price indexes.
This lets analysts study income, spending and inflation together.
59. Income versus spending
Consumer spending can rise because:
- income rose;
- saving fell;
- borrowing rose;
- prices rose.
The headline spending number is the beginning of the question.
60. JOLTS
BLS Job Openings and Labor Turnover Survey data provide information on:
- job openings;
- hires;
- quits;
- layoffs and discharges.
These measures add detail to the labour-demand picture beyond payroll growth alone.
61. Job openings are not filled jobs
A job opening indicates an employer wants to fill a position under the survey definition.
It is not the same as:
- a new payroll job;
- a new hire;
- an unemployed worker finding work.
Labour-market statistics contain several nouns on purpose.
62. Data revisions versus market memory
Markets often react most strongly to the first release because that is when information is newest.
Later revisions can change the historical picture, but the original market move already happened.
This creates a difficult truth for backtests:
use the data investors actually knew at the time
63. Look-ahead bias in macro backtests
If a strategy uses today's fully revised historical GDP or employment series to simulate decisions made years ago, it may accidentally use information that was unavailable then.
This is look-ahead bias.
History becomes much easier when allowed to send notes backward through time.
64. Real-time data matters
Professional macro research may use data vintages:
- what was reported first;
- what was known on a specific historical date;
- what was revised later.
Real-time databases help preserve those vintages.
65. Expectations can move before release day
Markets do not wait silently for CPI.
Expectations evolve from:
- commodity prices;
- wage data;
- business surveys;
- company commentary;
- prior economic releases.
By release morning, much of the broad story may already be priced.
66. Whisper numbers
Sometimes market expectations differ from published economist consensus.
Traders may refer informally to a whisper number: an unofficial expectation believed to be embedded in market pricing.
This is one reason a release that “beats consensus” can produce a surprisingly small reaction.
67. Positioning matters
Suppose everyone is already positioned for hot inflation.
Hot inflation arrives.
The result can still produce little new selling if:
- the surprise is small;
- the trade is already crowded;
- investors were expecting worse.
Market reaction depends on information and positioning.
68. Liquidity matters
Around major releases:
- quotes can move rapidly;
- spreads can widen;
- orders can execute away from expected prices;
- volatility can spike.
A scheduled event does not guarantee orderly execution.
69. Why the First Market Reaction Can Reverse
The first move after a release can reverse.
Why?
- algorithms react to the headline;
- humans read the details;
- revisions are discovered;
- cross-asset implications become clearer.
The first ten seconds and the next two hours can tell different stories.
70. A Practical Economic-Release Analysis Framework
A disciplined release read asks:
- What was expected?
- What was actual?
- What was revised?
- Which subcomponents drove the result?
- Was the series seasonally adjusted?
- Was the rate monthly, annualized or year-over-year?
- What does this imply for growth?
- What does this imply for inflation?
- What does this imply for monetary policy?
- What did markets actually do?
71. Bond-market reaction framework
Ask:
- Did the release change expected central-bank policy?
- Did short yields move?
- Did long yields move?
- Did the curve steepen or flatten?
- Did inflation expectations move?
Bonds are often the cleanest first place to see a macro surprise being repriced. The Yield Curve lesson explains how different maturities can react differently when growth, inflation or policy expectations change.
72. Equity-market reaction framework
Ask:
- Did growth expectations improve or deteriorate?
- Did discount rates rise or fall?
- Which sectors are most sensitive?
- Did earnings expectations change?
- Was positioning already extreme?
A stock index combines the earnings story and the discount-rate story.
Those stories occasionally argue in public.
73. Currency-market reaction framework
Ask:
- Did expected domestic policy change?
- How did that change relative to foreign policy expectations?
- Did risk appetite change?
- Did growth expectations change?
Currency remains a relative-price market. The Currency Moves and Corporate Exposure lesson shows how exchange-rate changes can then feed into company revenue, costs and reported earnings.
74. Commodity-market reaction framework
Ask:
- Did the release change expected demand?
- Did the U.S. dollar move?
- Did interest rates move?
- Is the commodity responding to macro demand or its own physical supply story?
A jobs report can matter to copper.
Copper still reserves the right to care more about a mine closure.
75. Strong growth plus cool inflation
A release combination suggesting:
- resilient growth;
- easing inflation
can be supportive for risk assets because earnings expectations can improve without requiring tighter policy.
Markets sometimes call this a favourable soft-landing mix.
76. Strong growth plus hot inflation
This can create:
- higher earnings expectations;
- higher rate expectations;
- higher bond yields;
- valuation pressure.
Equity reaction depends on which force wins.
77. Weak growth plus cool inflation
This can increase expectations for easier monetary policy.
Bonds may benefit from lower yield expectations.
Stocks may benefit if investors believe easing will prevent a deep downturn.
Or stocks may fall if recession fears dominate.
78. Weak growth plus hot inflation
This is one of the most difficult combinations.
Policymakers face:
- growth weakness;
- persistent inflation.
Markets get fewer comfortable policy choices.
Macroeconomics has selected hard mode again.
79. Headline versus breadth
A strong headline can hide weak breadth.
Example:
- retail sales beat because one category surged;
- most other categories weakened.
Or:
- payroll growth is strong;
- job gains are concentrated in a few industries.
Breadth helps determine how general the signal is.
80. Levels versus rates of change
An unemployment rate can be low while rising.
Inflation can be high while falling.
GDP can be positive while decelerating.
Markets frequently respond to:
- level;
- direction;
- acceleration;
- surprise.
Four questions for every number.
81. One release does not define the economy
Economic statistics are noisy.
A single month can be affected by:
- weather;
- strikes;
- calendar effects;
- temporary price moves;
- sampling variation.
Look for persistence and confirmation across data.
82. Do not average incompatible indicators into soup
Payroll growth, CPI, GDP and retail sales measure different things.
More indicators do not automatically create better analysis.
First understand the question each series answers.
Then combine them.
Otherwise the dashboard is merely decorative soup.
83. A Practical Economic-Release Day Workflow
- Before release: write down consensus and the key market sensitivity.
- At release: record actual versus consensus.
- Check revisions: especially for payrolls, GDP and retail sales.
- Read components: do not stop at headline.
- Identify measurement: monthly, yearly, annualized, adjusted or unadjusted.
- Translate to macro: growth, inflation, employment.
- Translate to policy: tighter, easier or unchanged expectations?
- Check bonds: which maturities moved?
- Check equities and FX: did they confirm the story?
- Reassess after 15–60 minutes: did the first reaction hold?
84. Economic-Release Market Reaction Template
| Field | What to Record |
|---|---|
| Release | CPI, payrolls, GDP, retail sales, etc. |
| Actual | Published result |
| Consensus | Expected result |
| Prior / revision | Previous result and any update |
| Key detail | Core inflation, wages, components, breadth, etc. |
| Macro implication | Growth / inflation / labour |
| Policy implication | Expected rate path |
| Market reaction | Yields / curve / stocks / FX |
85. Eight terrible economic-release conclusions
- “CPI rose 0.3%, therefore inflation is 0.3%.”
- “Payrolls beat consensus, so the jobs report was unquestionably strong.”
- “GDP was revised, therefore the original data was fake.”
- “Retail sales rose 5%, so consumers bought 5% more stuff.”
- “The unemployment rate rose, therefore everyone lost jobs.”
- “Hot inflation is always bearish for every stock.”
- “Good economic news should make stocks rise. The market is obviously broken.”
- “I saw the headline. Details are for people without notifications enabled.”
86. Ten mental models worth keeping
- Actual versus expectation drives surprise.
- Always check revisions.
- Monthly and year-over-year rates answer different questions.
- Base effects can move annual inflation mechanically.
- CPI, PPI and PCE measure related but different price concepts.
- The Employment Situation contains two major surveys.
- GDP is revised because source data becomes more complete.
- Nominal retail sales can rise because prices rose.
- The market reaction depends on the macro regime and policy implication.
- Read the release, then read the market.
Economic Data and Stock Market Reaction Questions
Why does economic data move the stock market?
Economic data can change expectations for growth, inflation, corporate earnings and interest rates. Markets react most strongly when the released number differs from what investors had already expected and priced in.
Why can strong economic data make stocks fall?
Strong data can raise expectations for higher interest rates or delay expected rate cuts. Higher discount rates can pressure stock valuations even when the economic growth signal itself is positive.
Why can weak economic data make stocks rise?
Weak data can support stocks when investors believe it will lead to easier monetary policy without causing a severe downturn in earnings. If recession fears dominate instead, the same weak data can push stocks lower.
How should investors read a CPI release?
Compare the actual CPI result with consensus expectations and the prior reading, then separate monthly from year-over-year inflation, headline from core measures and any base effects. Finally, observe how bond yields and policy expectations changed after the release.
What should you check first in a jobs report?
Start with payroll growth, unemployment, wages and revisions to prior months. The Employment Situation combines different surveys, so a strong headline payroll number can coexist with weaker details elsewhere in the report.
Quick knowledge check
Ten questions. Consensus expects 8.4 correct. Surprise us responsibly.
1. What three numbers should you check first in a major economic release?
The actual result, the consensus expectation, and the prior result including any revisions.
2. Why can a stronger-than-expected economic report make stocks fall?
It can raise inflation or interest-rate expectations, increasing discount rates or expectations for tighter monetary policy even if economic growth looks stronger.
3. What is a base effect?
A change in a year-over-year growth rate caused partly by the unusually high or low comparison period from one year earlier entering or leaving the calculation.
4. What is the difference between CPI and PPI at a high level?
CPI measures price changes from the consumer purchaser perspective, while PPI measures changes in selling prices received by domestic producers.
5. What are the two major surveys in the Employment Situation?
The household survey, or Current Population Survey, and the establishment survey, or Current Employment Statistics survey.
6. Why can household and payroll employment measures differ?
They use different samples and concepts: one primarily measures people and labour-force status, while the other measures payroll jobs, hours and earnings at establishments.
7. Why is GDP revised after the advance estimate?
Because more complete source data becomes available after the early estimate, allowing BEA to update the calculation.
8. Are advance retail-sales estimates adjusted for price changes?
No. Census advance retail-sales estimates are seasonally adjusted but not adjusted for changes in prices.
9. Why can the first market reaction reverse after an economic release?
The headline may be processed first, while investors later incorporate revisions, subcomponents, measurement details and cross-market implications.
10. What is the best general framework for interpreting a release?
Compare actual with expectations and revisions, understand the details, translate the result into growth/inflation/policy implications, and then observe how bonds, equities and currencies repriced.
Foundation Path complete
That completes the currently defined StockScreen.art Foundation Path.
We started with:
- what securities actually are;
- how markets trade them;
- how companies create revenue, earnings and cash flow;
- how valuation works;
- how technical analysis and screening work;
- how leverage and derivatives change risk;
- how positions interact inside portfolios;
- how macroeconomic forces reach securities and markets.
The final skill is not memorizing every indicator.
It is learning to ask:
“What exactly changed, compared with what expectation, through what mechanism, and with what risk?”
That question travels well.
It works for a CPI report.
It works for an earnings release.
It works for a commodity shock.
It works for a stock screener.
It even works when someone on television says:
“Markets are down because investors are taking profits.”
At that point you are officially allowed to ask for more evidence.
Primary sources & further reading
- U.S. Bureau of Labor Statistics — Economic News Release Calendar
- U.S. Bureau of Labor Statistics — Consumer Price Index
- U.S. Bureau of Labor Statistics — Employment Situation
- U.S. Bureau of Labor Statistics — Producer Price Index
- U.S. Bureau of Economic Analysis — Gross Domestic Product
- U.S. Bureau of Economic Analysis — PCE Price Index
- U.S. Census Bureau — Monthly Retail Trade