Interest rates are not one number.
There is a rate for overnight money.
Another for three months.
Another for two years.
Another for ten years.
Another for thirty years.
Put those yields on a chart from shortest maturity to longest, and congratulations:
you have met the yield curve.
1. What exactly is on the chart?
A basic yield curve has:
- maturity on the horizontal axis;
- yield on the vertical axis.
Moving from left to right means moving from shorter-term debt to longer-term debt.
2. Compare like with like
A useful yield curve compares securities that are similar except for maturity.
The U.S. Treasury curve is commonly used because Treasury securities provide a deep market across many maturities and avoid mixing large differences in corporate credit quality into the picture.
Comparing:
- a 3-month Treasury bill;
- a 2-year Treasury note;
- a 10-year Treasury note;
- a 30-year Treasury bond
makes more sense than drawing one curve through a Treasury bill, a junk bond, a mortgage and your cousin's IOU.
3. What is a yield?
A bond's yield is a return measure that relates the bond's cash flows and price.
There are several yield definitions, including:
- current yield;
- yield to maturity;
- par yield;
- zero-coupon or spot yield.
“Yield” is therefore a family name.
Always check which relative has entered the room.
4. The U.S. Treasury par yield curve
The U.S. Department of the Treasury publishes daily Treasury par yield curve rates.
Treasury describes the par yield curve as relating the par yield on a security to its time to maturity, based on market quotations and its published methodology.
This is one of the most familiar official U.S. yield-curve datasets.
5. Par yield
A par yield is the coupon rate that would make a bond trade at approximately par value under the relevant curve assumptions.
A par curve is convenient for quoting benchmark yields across maturities.
It is not exactly the same thing as a zero-coupon spot curve.
6. Spot or zero-coupon curve
A spot curve contains yields for single future cash flows at different maturities.
In theory, each future cash flow can be discounted using the spot rate appropriate to its timing.
Spot curves are important for valuation.
We will admire them respectfully from Foundation Path distance.
7. Forward curve
A forward rate is a rate implied today for borrowing or investing over a future period, based on the current term structure.
Forward rates are not guaranteed forecasts of the rates that will actually occur.
They contain market pricing and risk-premium effects.
8. Three curves, three questions
Simplified:
- Par curve: what coupon would place a benchmark bond around par?
- Spot curve: what discount rate applies to a cash flow at this maturity?
- Forward curve: what future-period rate is implied by today's term structure?
Same fixed-income family.
Different chores.
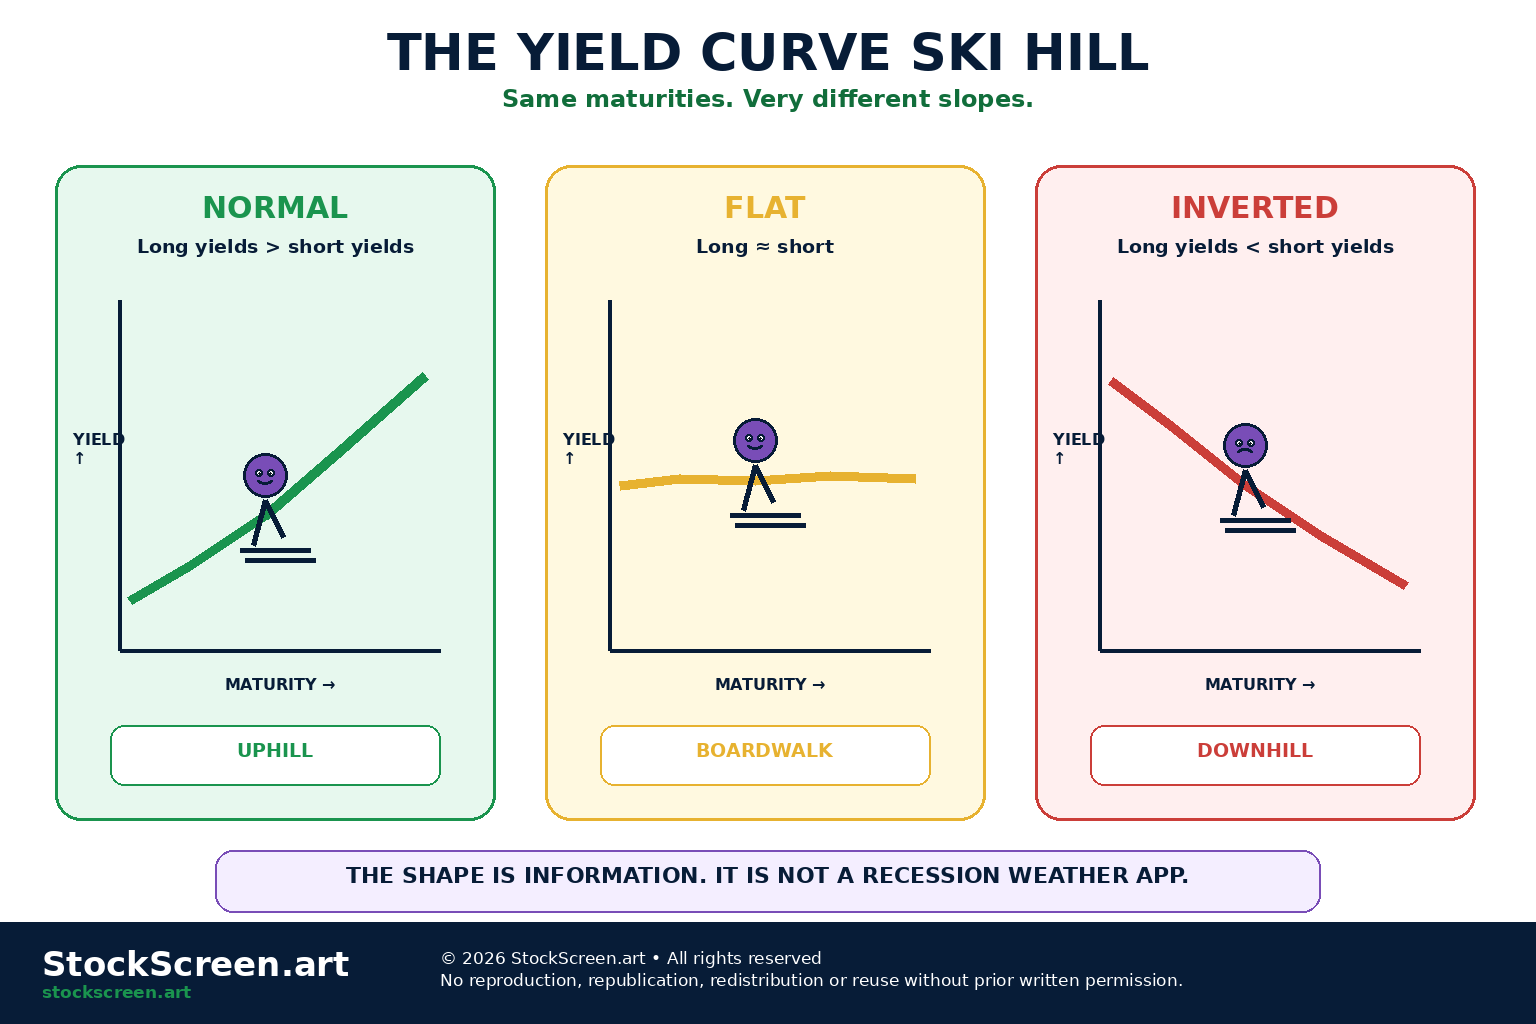
9. The normal upward-sloping curve
A curve is commonly called normal when longer-term yields are higher than shorter-term yields.
Visually:
short yields lower → long yields higher
The curve slopes upward.
10. Why might longer maturities yield more?
Longer maturities expose investors to more uncertainty about:
- future inflation;
- future interest rates;
- economic conditions;
- the value of money many years from now.
Investors may require additional compensation for bearing that uncertainty.
That compensation is related to the idea of a term premium.
11. The flat yield curve
A flat curve means short-term and long-term yields are relatively similar.
A curve can flatten because:
- short yields rise;
- long yields fall;
- both move but the gap narrows.
Flat does not mean nothing happened.
It means the difference between maturities became smaller.
12. The inverted yield curve
A curve is inverted when shorter-term yields exceed longer-term yields over some part of the curve.
Example:
- 2-year Treasury yield = 5.0%;
- 10-year Treasury yield = 4.2%.
The 10-year minus 2-year spread is:
4.2% − 5.0% = −0.8 percentage point
or:
−80 basis points
13. Yield spreads
A yield spread is simply the difference between two yields.
For example:
10-year/2-year spread = 10-year yield − 2-year yield
A positive number means the 10-year yield is higher.
A negative number means the 10-year yield is lower.
14. The 10-year minus 3-month spread
Another widely studied term spread is:
10-year Treasury yield − 3-month Treasury yield
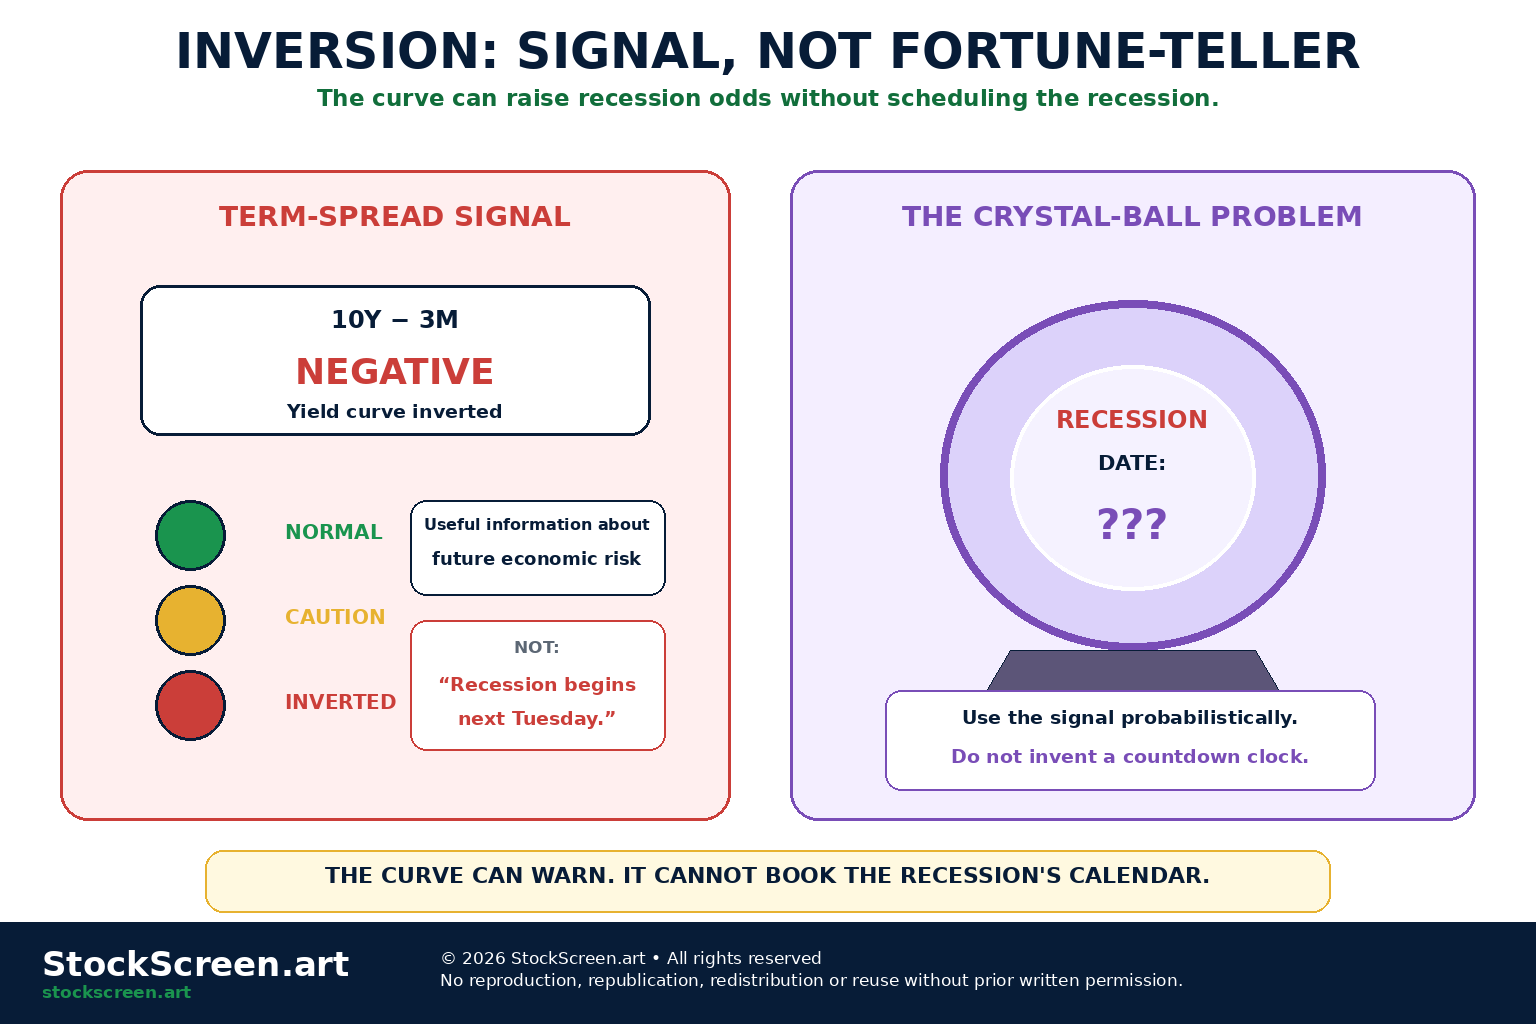
The Federal Reserve Bank of New York has long published research using this spread to estimate the probability of a U.S. recession twelve months ahead.
Notice the wording:
probability
not:
appointment confirmation
15. Why inversion can contain economic information
An inversion often means short-term rates are high relative to longer-term rates.
One possible interpretation is:
- policy is currently restrictive;
- investors expect future growth and inflation to slow;
- markets expect future policy rates eventually to fall.
That combination can occur before economic weakness.
16. Inversion does not cause recession mechanically
An inverted curve is not a switch that turns recession on.
It reflects financial conditions and expectations that may themselves be connected to the future economy.
Correlation, information and causation remain different words for a reason.
17. Inversion is not a precise clock
Even when an inversion precedes recession, the lead time can vary.
Markets can:
- invert early;
- remain inverted for a long period;
- un-invert before economic weakness becomes obvious.
There is no recession countdown timer embedded in the 10-year note.
18. Not every inversion is identical
The signal can depend on:
- which maturities are compared;
- how deeply the curve is inverted;
- how long inversion persists;
- what inflation is doing;
- what monetary policy is doing;
- what term premiums are doing.
“The curve inverted” is a starting sentence, not the full analysis.
19. The short end of the curve
Very short-term yields are heavily influenced by:
- the current policy rate;
- expectations for upcoming central-bank decisions;
- money-market conditions.
If markets expect central-bank tightening, short yields can rise before the next meeting.
20. The long end of the curve
Longer-term yields reflect a broader set of forces:
- expected future short-term rates;
- long-run inflation expectations;
- economic growth expectations;
- term premium;
- bond supply and demand;
- risk and uncertainty.
The 30-year yield has more on its calendar than next month's policy meeting.
21. Expectations hypothesis intuition
A useful starting idea is that a long-term yield contains information about expected future short-term interest rates.
If investors expect short-term rates to be much lower in future years, that expectation can pull longer yields below current short rates.
But expectations alone are not the full story.
22. The term premium
The term premium is additional compensation investors may require for holding longer-term bonds rather than repeatedly investing in short-term instruments.
Federal Reserve term-structure models commonly decompose longer-term yields into:
- expected future short rates;
- a term-premium component.
Both components are model estimates.
23. Term premium is not constant
The term premium can change because of:
- inflation uncertainty;
- interest-rate uncertainty;
- bond supply;
- investor demand;
- central-bank balance-sheet policy;
- risk appetite.
This is why a long-term yield can rise even when expectations for the near-term policy rate barely change.
24. A rising 10-year yield can mean several things
It might reflect:
- stronger expected growth;
- higher expected inflation;
- a higher term premium;
- more bond supply;
- reduced demand for duration;
- some combination of the above.
One yield.
Several possible suspects.
25. A falling 10-year yield can mean several things too
It might reflect:
- weaker growth expectations;
- lower inflation expectations;
- expected future rate cuts;
- safe-haven demand;
- a lower term premium.
“Yields fell” is not yet an explanation.
26. Steepening
A yield curve steepens when the gap between longer-term and shorter-term yields becomes larger.
Example:
- 10-year minus 2-year spread moves from 0.20% to 0.90%.
The curve became steeper.
27. Flattening
A yield curve flattens when the gap between longer-term and shorter-term yields becomes smaller.
Example:
- 10-year minus 2-year spread moves from 1.20% to 0.30%.
The curve flattened.
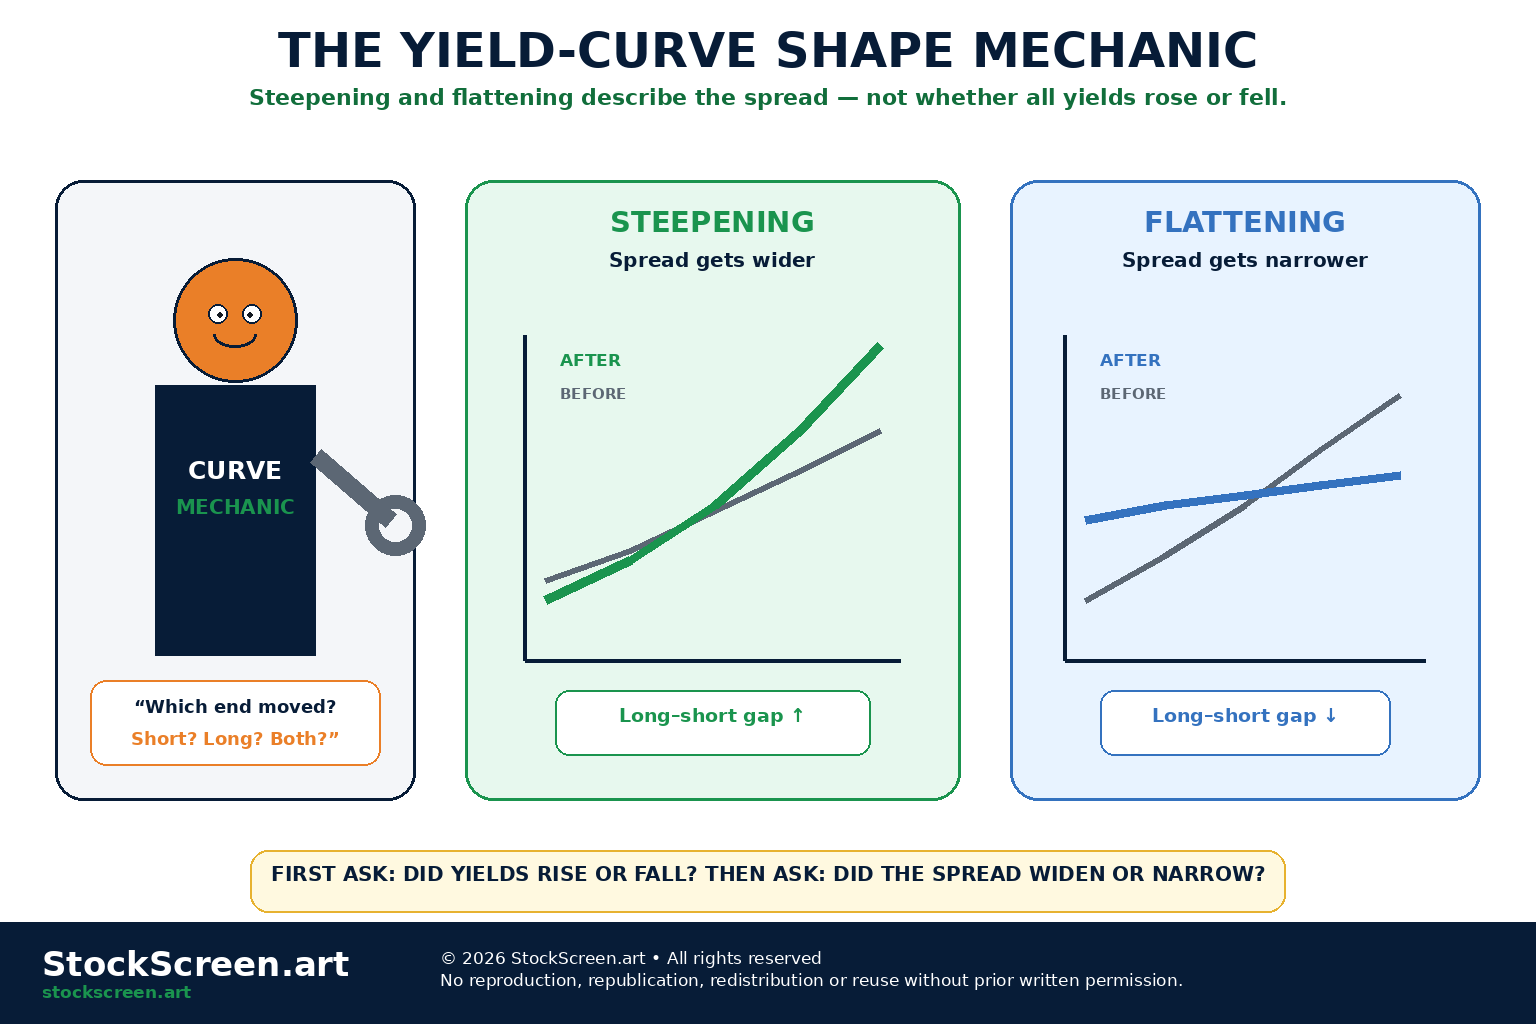
28. Steepening does not tell you whether yields rose or fell
This is important.
A curve can steepen because:
- long yields rise faster than short yields;
- short yields fall faster than long yields.
Both produce a wider spread.
The economic story can be very different.
29. Bull versus bear curve moves
Bond-market language often uses:
- bull when yields are generally falling and bond prices rising;
- bear when yields are generally rising and bond prices falling.
Combine that with steepening or flattening, and we get four very finance-looking phrases.
30. Bull steepener
A bull steepener occurs when yields fall, with shorter-term yields generally falling faster than longer-term yields.
This can happen when markets rapidly price:
- future central-bank easing;
- economic weakness;
- lower near-term inflation pressure.
“Steeper” does not necessarily mean “stronger economy.”
31. Bear steepener
A bear steepener occurs when yields rise, with longer-term yields generally rising faster than shorter-term yields.
Possible drivers include:
- stronger long-run growth expectations;
- higher inflation uncertainty;
- higher term premiums;
- heavy long-term bond supply.
32. Bull flattener
A bull flattener occurs when yields fall, with longer-term yields falling more than shorter-term yields.
The curve becomes flatter while bond prices generally rise.
33. Bear flattener
A bear flattener occurs when yields rise, with shorter-term yields rising more than longer-term yields.
This often appears when markets price tighter near-term monetary policy.
Four phrases.
One useful rule:
first ask what happened to yields, then ask what happened to the spread
34. Parallel shifts
Sometimes yields across maturities move by roughly similar amounts.
This is called a parallel shift.
Real yield curves rarely move perfectly in parallel.
Fixed-income textbooks nevertheless enjoy the idea because the diagrams behave.
35. Non-parallel shifts
More often:
- short yields move more;
- long yields move more;
- the middle of the curve moves differently.
This changes:
- slope;
- curvature;
- relative bond performance.
36. Humped curves
A yield curve can be humped, meaning intermediate maturities yield more than both shorter and longer maturities.
This can reflect:
- unusual policy expectations;
- temporary supply-demand conditions;
- market uncertainty concentrated at particular horizons.
The curve occasionally decides three dimensions were not enough.
37. Curvature matters
Analysts often describe the term structure using three broad concepts:
- level — where yields are overall;
- slope — the short-versus-long difference;
- curvature — how the middle differs from the ends.
These ideas are used in many fixed-income models.
38. Bond prices and yields move inversely
Investor.gov explains a central fixed-income relationship:
when market interest rates rise, prices of existing fixed-rate bonds generally fall
and vice versa.
This happens because older bond cash flows must compete with newly issued bonds at current rates.
39. Why a higher yield means a lower bond price
Suppose an existing bond pays a fixed coupon.
If newly issued comparable bonds offer higher yields, investors will generally pay less for the old bond until its return becomes competitive.
Price down.
Yield up.
Fixed-income seesaw.
40. Duration
Duration is a measure related to the timing of a bond's cash flows and its sensitivity to changes in yield.
All else equal, longer-duration bonds tend to experience larger price changes for a given change in yield.
Duration is not identical to maturity, although the two are related.
41. Why the long end matters for portfolios
Changes in longer-term yields can affect:
- government bond prices;
- corporate bond prices;
- mortgage rates;
- equity discount rates;
- real-estate financing;
- currency valuations.
The yield curve leaks into nearly every room of finance.
42. Mortgage rates do not equal the 10-year Treasury yield
Mortgage rates can be influenced by:
- Treasury yields;
- mortgage-backed security spreads;
- prepayment risk;
- credit and funding conditions;
- lender competition.
The 10-year Treasury is useful context, not a mortgage-rate photocopier.
43. Corporate bond yields
A corporate bond yield can be thought of conceptually as including:
- a benchmark interest-rate component;
- a credit spread and other compensation for risk.
Therefore corporate yields can rise even if Treasury yields fall, if credit spreads widen enough.
44. Credit spreads are not the Treasury yield curve
A Treasury curve mainly describes the term structure of benchmark government yields.
A corporate credit spread measures additional yield compensation relative to a benchmark.
Mixing them together without labels creates a chart with excellent confidence and questionable parentage.
45. Yield curve and bank profitability
Banks often:
- fund themselves partly at shorter maturities;
- lend or invest at longer maturities.
A steeper curve can support some forms of maturity transformation.
But bank profitability also depends on:
- deposit pricing;
- credit losses;
- loan growth;
- competition;
- hedging;
- balance-sheet structure.
“Steep curve = banks win” is another slogan that needs adult supervision.
46. Inversion and bank lending
When short-term funding is expensive relative to longer-term lending rates, some forms of traditional lending economics can become less attractive.
But real bank balance sheets are more complex than:
borrow at 2 years, lend at 10 years
Deposits, hedges, fees and asset composition matter.
47. Yield curve and equities
Stocks respond to the curve through several channels:
- discount rates;
- growth expectations;
- credit conditions;
- sector sensitivity;
- relative attractiveness of bonds.
The same steepening can be bullish in one context and alarming in another.
48. Growth stocks and long yields
Businesses valued heavily on cash flows expected far in the future can be sensitive to changes in long-term discount rates.
Higher long yields can pressure valuation multiples, all else equal.
Stronger expected growth can offset part of that effect.
Markets remain stubbornly multivariable.
49. Defensive stocks and curve signals
If curve flattening reflects increasing recession concerns, investors may favour some defensive sectors.
But starting valuation and company fundamentals still matter.
The yield curve does not issue sector allocation commandments.
50. Yield curve and currencies
Currency markets compare interest-rate structures across countries.
Investors may care about:
- current short-term rates;
- expected policy paths;
- long-term yields;
- inflation expectations.
A single domestic yield curve is only half of a currency-pair conversation.
51. Yield curve and commodities
Interest rates can influence:
- the U.S. dollar;
- financing costs;
- inventory carrying costs;
- economic-growth expectations.
These can affect commodities.
But physical supply and demand remain central.
RW-04 goes there next.
52. Nominal yield curve
A standard Treasury yield curve is usually discussed in nominal terms.
Nominal yields incorporate compensation related to:
- real interest rates;
- expected inflation;
- risk premiums.
53. Real yield curve
Treasury Inflation-Protected Securities, or TIPS, allow analysts to examine a real-yield curve.
Real yields are conceptually closer to returns after accounting for inflation adjustments built into the security.
TIPS have their own market and liquidity characteristics.
54. Breakeven inflation
Analysts often compare nominal Treasury yields with TIPS real yields at similar maturities.
The difference is commonly called a breakeven inflation rate.
Simplified:
nominal yield − real yield ≈ breakeven inflation
It is a market-based measure, not a pure forecast of future CPI.
55. Breakevens contain more than expectations
Breakeven inflation can also reflect:
- inflation risk premiums;
- liquidity differences;
- technical market factors.
Once again, markets have hidden ingredients.
56. Curve inversion can end in different ways
Suppose the curve is inverted.
It can normalize because:
- short yields fall;
- long yields rise;
- both happen.
Those paths imply different economic stories.
57. Re-steepening is not automatically good news
A heavily inverted curve can steepen rapidly when markets expect aggressive future rate cuts because the economy is deteriorating.
That is a bull steepening scenario.
The curve looks more normal.
The reason can be distinctly abnormal.
58. Re-steepening can also reflect stronger nominal growth
Long yields can rise relative to short yields because investors price:
- stronger growth;
- higher inflation;
- larger term premiums.
That is a very different type of steepening.
59. One spread cannot describe the entire curve
The 10-year/2-year spread may be negative while another part of the curve is shaped differently.
Useful curve analysis can look at:
- 3-month versus 2-year;
- 2-year versus 10-year;
- 5-year versus 30-year;
- the overall level and curvature.
One ruler cannot measure every corner of the room.
60. Why different recession indicators use different spreads
Different researchers have studied different maturity pairs.
The New York Fed's long-running recession-probability model uses the 10-year minus 3-month spread.
Market commentary also frequently follows 10-year minus 2-year.
These are related, but they are not interchangeable definitions.
61. The curve can be wrong
A yield curve reflects market prices and expectations.
Markets can misjudge:
- future inflation;
- future policy;
- growth;
- recession risk;
- term premiums.
The bond market contains a lot of information.
It does not contain future newspapers.
62. The curve can move after one economic release
A jobs, inflation or growth report can change expectations for:
- the next central-bank meeting;
- the path of rates over the next year;
- long-run inflation;
- recession risk.
Different maturities may react by different amounts.
63. Watch the move, not just the level
A 10-year yield of 4% means different things if it:
- fell from 5%;
- rose from 3%;
- has been stable for months.
Direction and speed contain information.
64. Watch why the curve moved
Ask:
- Did the short end move because policy expectations changed?
- Did the long end move because inflation expectations changed?
- Did term premium move?
- Did credit stress change?
- Did Treasury supply matter?
Shape without cause is only geometry.
65. Yield curve as economic dashboard
The curve can provide clues about:
- monetary-policy expectations;
- growth expectations;
- inflation;
- risk premiums;
- financial conditions.
It compresses many opinions into a set of market prices.
66. Yield curve as portfolio input
Portfolio managers use the curve to think about:
- duration;
- maturity allocation;
- income;
- reinvestment risk;
- credit spreads;
- hedging.
The curve affects both macro analysis and actual portfolio mechanics.
67. A practical yield-curve dashboard
A beginner dashboard could include:
- 3-month Treasury yield.
- 2-year Treasury yield.
- 10-year Treasury yield.
- 30-year Treasury yield.
- 10-year minus 2-year spread.
- 10-year minus 3-month spread.
- recent curve direction: steepening or flattening.
- inflation expectations or breakevens.
Eight numbers are enough to learn quite a lot.
Please resist building a 97-column dashboard before breakfast.
68. A practical interpretation checklist
- What is the overall level of yields?
- Is the curve upward, flat, inverted or humped?
- Which spread am I actually discussing?
- Is the curve steepening or flattening?
- Are yields rising or falling while that happens?
- Did the short end or long end drive the move?
- What changed in policy expectations?
- What changed in inflation or growth expectations?
- Could term premium or supply-demand explain part of the move?
- What would falsify my interpretation?
69. Eight terrible yield-curve conclusions
- “The curve inverted. Recession begins Thursday.”
- “The curve steepened, therefore economic growth must be improving.”
- “The 10-year yield rose, so inflation expectations definitely rose.”
- “The Fed controls the 30-year yield directly.”
- “A flat curve means rates did not move.”
- “Ten-year minus two-year and ten-year minus three-month are the same signal.”
- “Breakeven inflation is the market's exact CPI forecast.”
- “I drew a line between four yields. Macroeconomics has been solved.”
70. Ten mental models worth keeping
- The yield curve is yield versus maturity.
- Compare similar debt instruments when reading curve shape.
- The short end listens closely to monetary-policy expectations.
- The long end reflects expected future short rates plus term-premium forces.
- Inversion is information, not a countdown clock.
- Steepening and flattening describe spreads—not the direction of all yields.
- Ask bull or bear after asking steepener or flattener.
- Bond prices generally move opposite to yields.
- One spread cannot describe the entire term structure.
- Always ask why the curve moved.
Quick knowledge check
Ten questions. The quiz curve is currently normal, with difficulty increasing modestly by maturity.
1. What does a yield curve plot?
Yields on comparable debt securities against their maturities.
2. What is an inverted yield curve?
A curve in which shorter-term yields exceed longer-term yields over some part of the maturity spectrum.
3. How is a 10-year minus 2-year spread calculated?
Subtract the 2-year yield from the 10-year yield.
4. Does an inverted Treasury curve guarantee a recession?
No. It has historically contained predictive information, but it is a probabilistic signal and does not guarantee timing or outcome.
5. What two broad components are often used conceptually to explain a long-term yield?
Expected future short-term rates and a term-premium component.
6. What is the difference between steepening and flattening?
Steepening means the gap between longer- and shorter-term yields widens; flattening means the gap narrows.
7. Can a curve steepen while yields are falling?
Yes. If short-term yields fall faster than long-term yields, the result is commonly called a bull steepener.
8. What generally happens to the price of an existing fixed-rate bond when market yields rise?
Its market price generally falls, all else equal.
9. What is the difference between a par curve and a spot curve?
A par curve relates par yields to maturity, while a spot curve represents discount rates for single future cash flows at different maturities.
10. What is the best first question when the yield curve moves?
Which maturities moved, in which direction, and what changed in policy, growth, inflation or term-premium expectations?
Where we go next
The yield curve tells us how markets price money across time.
Next we move from money to things that are considerably harder to create with a keyboard:
- oil;
- copper;
- natural gas;
- metals;
- agricultural products.
Next:
FND-RW-04 — Commodity Markets and Sector Effects.
We will connect commodity-price moves to producers, consumers, margins, inflation and sector performance— because a $20 move in oil is excellent news for one income statement and an extremely impolite email for another.
Primary sources & further reading
- U.S. Department of the Treasury — Interest Rate Statistics
- U.S. Department of the Treasury — Treasury Yield Curve Methodology
- Federal Reserve Bank of New York — The Yield Curve as a Leading Indicator
- Federal Reserve Board — Yield Curve Models and Data
- Investor.gov — When Interest Rates Go Up, Prices of Fixed-Rate Bonds Fall