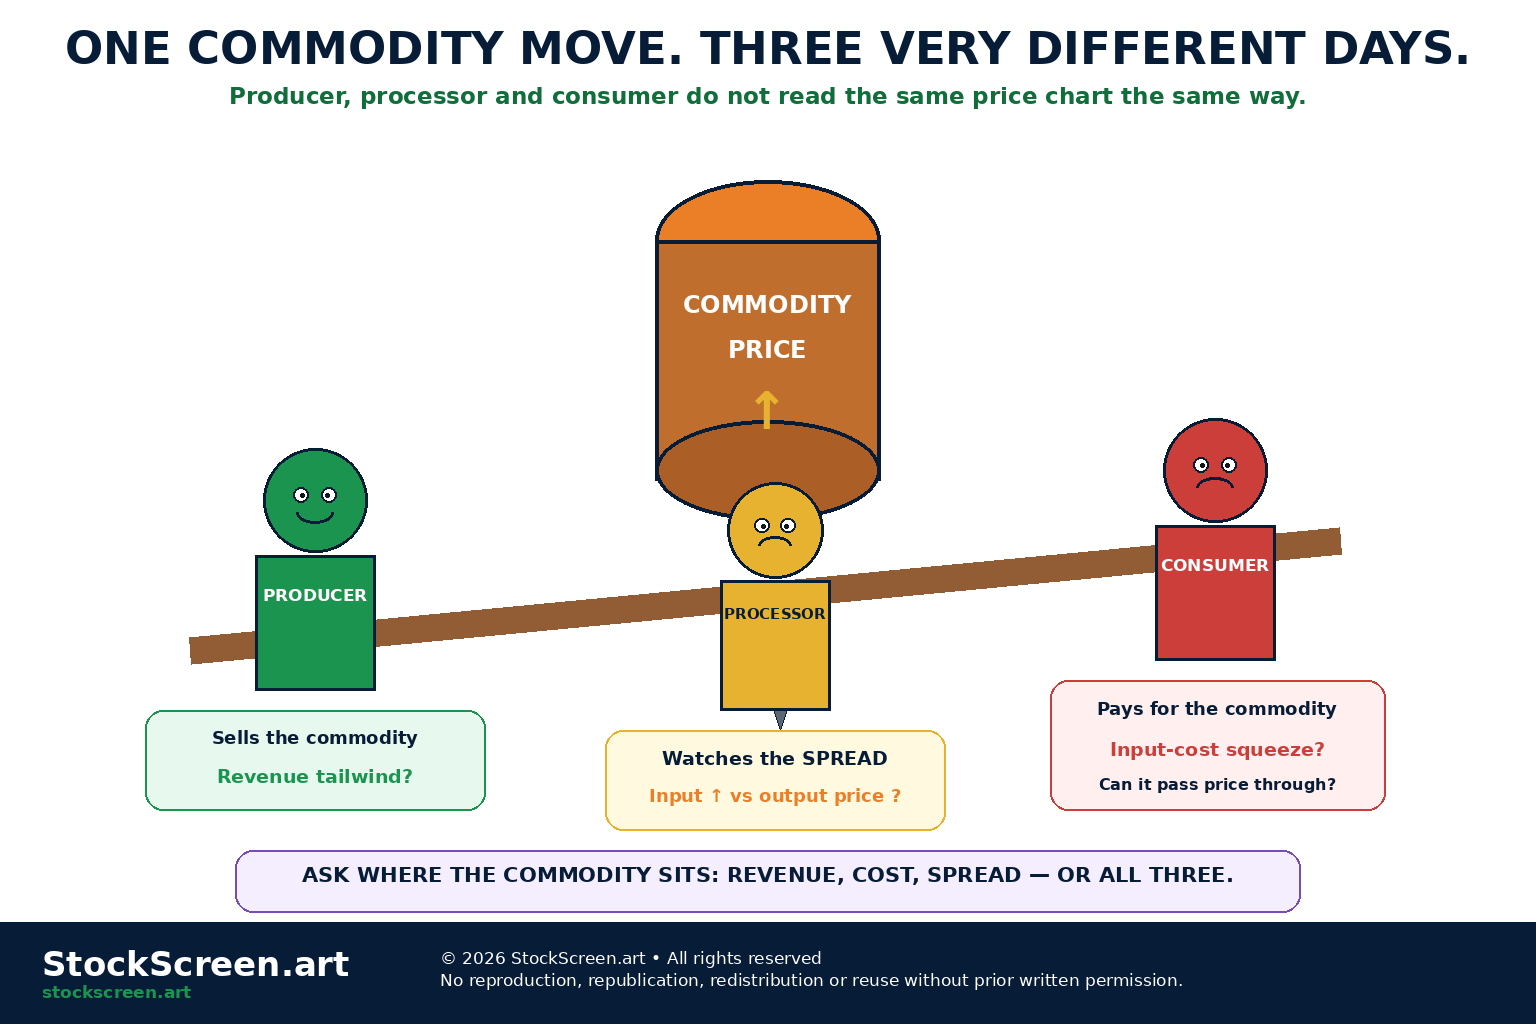
A barrel of oil rises in price.
Somewhere:
- an oil producer smiles;
- an airline accountant stops smiling;
- a refiner asks what gasoline did;
- a trucking company looks at diesel;
- a chemical company checks feedstock costs;
- an economist begins typing the word “inflation.”
Same barrel.
Very different afternoon.
1. Start with the value chain
A commodity rarely travels directly from the ground to the consumer.
A simplified value chain can contain:
- extraction or production;
- transportation;
- processing or refining;
- manufacturing;
- distribution;
- final consumption.
Each participant can have a different relationship with the same commodity price.
2. Upstream producers
Upstream businesses produce or extract raw commodities.
Examples include:
- oil and gas producers;
- copper miners;
- gold miners;
- farm producers;
- timber producers.
For these businesses, the commodity price is often closely connected to revenue.
3. Higher price can mean higher producer revenue
Simplified:
Revenue ≈ Volume Sold × Realized Commodity Price
If volume is unchanged and the realized selling price rises, revenue can increase.
That sounds straightforward.
Then accounting, hedging, royalties, quality discounts and transportation arrive with folding chairs.
4. Realized price is what matters
A company may not receive the exact benchmark price shown on television.
Its realized price can differ because of:
- location;
- quality or grade;
- transportation costs;
- contract terms;
- hedges;
- local supply-demand conditions.
Benchmark price is context.
Realized price enters the company's economics.
5. Producer operating leverage
Commodity producers can have significant operating leverage.
Imagine a fictional mine producing one unit at:
- selling price = $100;
- cash operating cost = $70.
Simplified contribution:
$100 − $70 = $30
6. A 20% commodity move can create a larger profit move
Now suppose the selling price rises 20% to $120 while the simplified operating cost remains $70.
$120 − $70 = $50
Price rose 20%.
Simplified contribution rose from $30 to $50:
about 67%
This is why commodity equities can move more violently than the commodity itself.
7. Operating leverage works both directions
If the commodity price falls from $100 to $80:
$80 − $70 = $10
A 20% commodity-price decline reduced the simplified contribution from $30 to $10.
The commodity sneezed.
The margin caught pneumonia.
8. Costs do not actually stay fixed forever
The simplified example isolates the idea.
Real producer costs can change with:
- fuel;
- labour;
- equipment;
- royalties;
- ore grade;
- water;
- power;
- transportation.
Commodity booms can eventually create cost inflation too.
9. Royalties and taxes can be price-sensitive
Some production royalties or fiscal regimes rise as commodity prices or profits rise.
Therefore:
higher benchmark price ≠ identical percentage increase in shareholder profit
Government also owns a calculator.
10. Volume matters alongside price
A producer can enjoy a higher commodity price while producing fewer units.
Revenue then depends on both:
- price;
- volume.
Production declines can offset favorable prices.
11. Reserve quality matters
Mining and energy companies differ in:
- resource quality;
- reserve life;
- development cost;
- decline rates;
- political jurisdiction;
- infrastructure access.
Two copper miners can face the same copper price and produce very different economics.
12. Commodity producers can become capital-spending machines
High prices can encourage:
- new drilling;
- mine expansion;
- exploration;
- equipment purchases;
- infrastructure investment.
That can benefit suppliers and industrial companies.
Commodity effects therefore travel outward.
13. Midstream and transportation
Some companies primarily move or store commodities rather than produce them.
Examples include:
- pipelines;
- storage operators;
- railways;
- shipping businesses;
- terminals.
Their revenue can depend more on volumes, contracts and tariffs than on the outright commodity price.
14. A pipeline is not an oil producer
If crude oil rises 20%, a pipeline company does not automatically receive 20% more revenue per barrel transported.
Contract structures can include:
- fixed fees;
- volume commitments;
- regulated tariffs;
- commodity-sensitive components.
Sector label:
Energy
Business model:
Please keep reading.
15. Refiners live on spreads
A refinery buys crude oil and sells refined products such as:
- gasoline;
- diesel;
- jet fuel;
- other petroleum products.
Therefore the raw crude price alone does not determine refinery profitability.
16. Crack spreads
The U.S. Energy Information Administration describes a crack spread as the difference between the purchase price of crude oil and the selling price of refined petroleum products.
It is used as an indicator of short-term refinery margins, although it does not include every variable or fixed cost.
Refiners care about:
output price − input price
not merely:
oil up or oil down
17. Oil can rise while refining margins fall
Suppose crude prices rise rapidly, but gasoline and diesel prices do not rise as much.
The spread can compress.
A refinery may therefore face worse economics despite a higher oil price.
“Energy up!” has already lost several important paragraphs.
18. Oil can fall while refining margins improve
The reverse can happen if crude input costs decline faster than refined-product prices.
Again:
spread matters
19. Refinery utilization matters too
Refinery economics also depend on:
- utilization;
- maintenance;
- outages;
- regional product demand;
- environmental specifications;
- transportation constraints.
A wonderful theoretical margin earns little if the refinery is offline.
20. Downstream commodity consumers
Many businesses consume commodities as inputs.
Examples include:
- airlines using jet fuel;
- truckers using diesel;
- food companies buying grains, oils and sugar;
- manufacturers using steel, aluminum and copper;
- chemical companies using oil and natural-gas feedstocks.
For these businesses, a commodity price can sit on the cost side of the income statement.
21. Input-cost inflation
Higher commodity prices can raise a company's cost of goods sold.
The margin effect depends on whether the company can:
- absorb the cost;
- reduce another cost;
- increase productivity;
- pass the cost to customers.
This brings us to pricing power.
22. Pricing power
Pricing power is the ability to raise selling prices without losing so much volume that the increase becomes self-defeating.
Companies with strong:
- brands;
- scarce products;
- switching costs;
- contractual pass-through clauses
may be better positioned to transmit input inflation to customers.
23. Pass-through is rarely instant
A commodity input can rise today.
A company may not reset selling prices until:
- the next contract;
- the next catalogue;
- the next quarter;
- the next negotiation.
This creates timing mismatches.
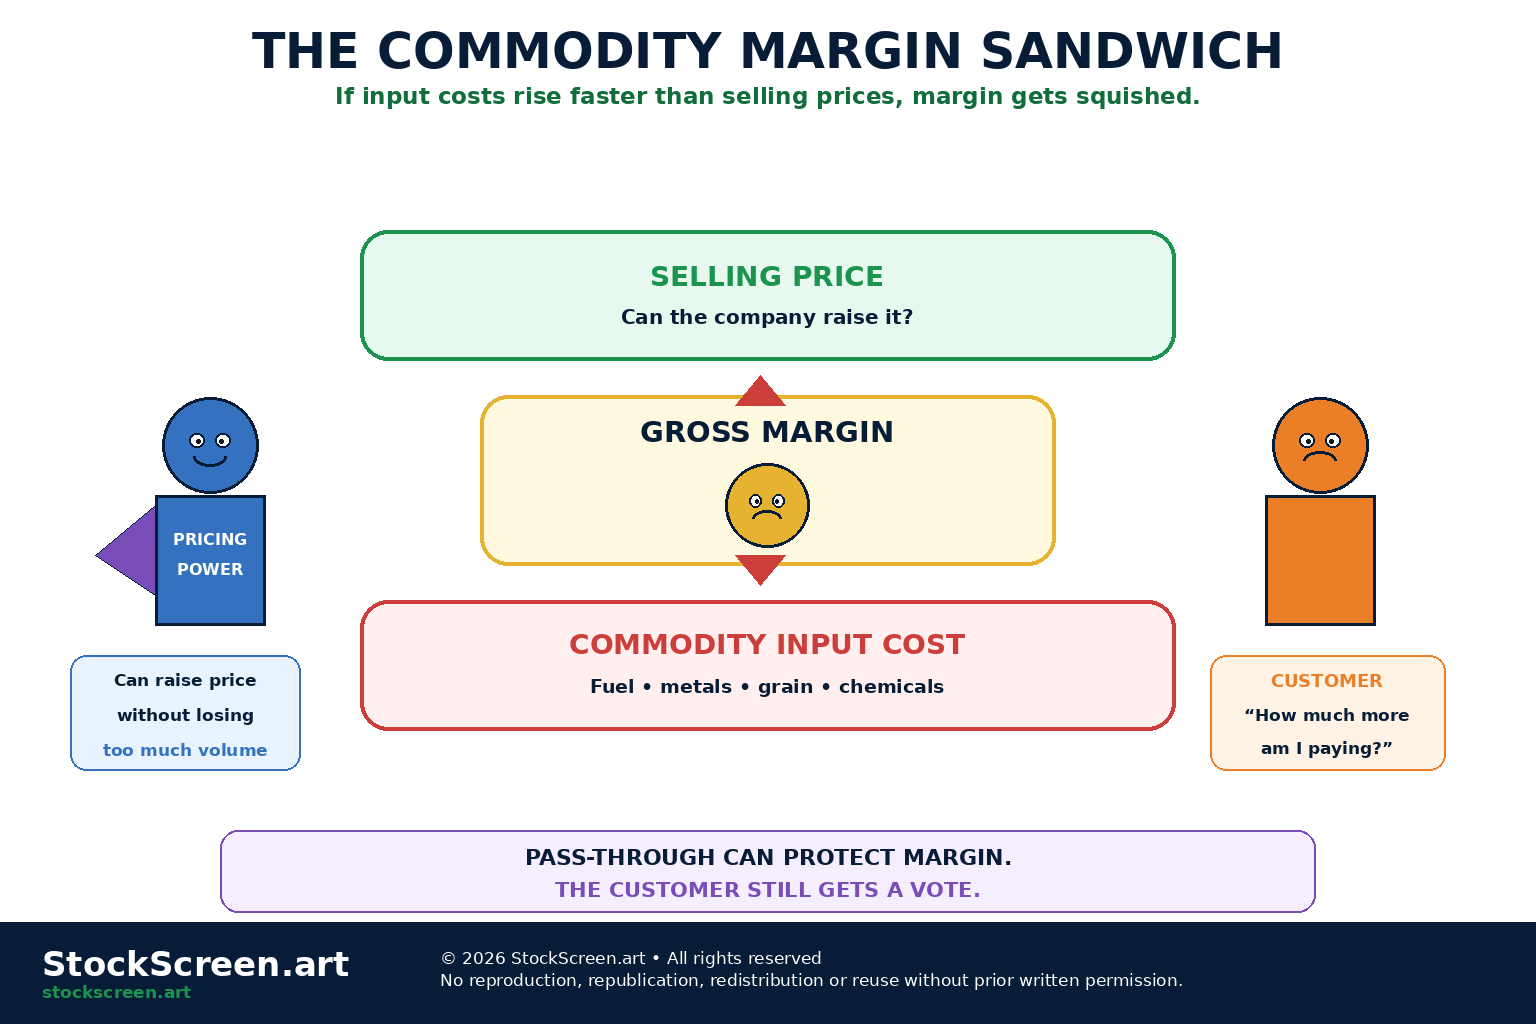
24. Margin squeeze
A simplified gross-margin relationship is:
Selling Price − Input Cost = Gross Profit per Unit
If input costs rise faster than selling prices, margins compress.
Commodity shock meets income statement.
25. Pass-through can preserve dollars but not demand
Suppose a company fully passes a commodity cost increase to customers.
Margin percentage might stabilize.
But customers may respond by buying less.
Pricing power therefore depends on both:
- ability to raise price;
- demand response after the increase.
26. Price elasticity enters the conversation
If customers sharply reduce purchases after a price increase, demand is relatively price-sensitive.
If demand changes little, the business has more room to pass through cost.
Commodity exposure is therefore also a customer-behaviour problem.
27. Food companies and farm commodities
Food manufacturers can be exposed to:
- wheat;
- corn;
- sugar;
- vegetable oils;
- dairy;
- meat;
- packaging;
- energy.
The farm commodity is only one part of the final retail price.
28. Farm prices do not pass through one-for-one to grocery shelves
USDA research has emphasized that retail food prices also reflect:
- processing;
- transportation;
- manufacturing;
- wholesale and retail costs;
- labour;
- other value added.
A 30% move in wheat does not imply every loaf of bread should move 30%.
The wheat has roommates.
29. Airlines and fuel
Jet fuel can be a significant airline operating cost.
Higher petroleum-product prices can pressure margins if:
- ticket prices cannot rise enough;
- demand is weak;
- hedges do not offset the increase;
- competitors maintain lower fares.
The relevant commodity exposure is not merely crude oil.
It is the actual fuel economics the airline experiences.
30. Transportation beyond airlines
Fuel prices can affect:
- trucking;
- shipping;
- rail;
- delivery networks;
- logistics companies.
Fuel-surcharge mechanisms can shift some exposure to customers.
Contract design again matters.
31. Chemicals and feedstocks
Chemical companies can use:
- natural gas;
- natural-gas liquids;
- oil-derived feedstocks;
- other raw materials.
Their competitive position may depend on regional feedstock prices as well as global product prices.
32. Natural gas is extremely regional
Natural-gas economics are shaped by:
- production;
- storage;
- weather;
- pipeline capacity;
- LNG export capacity;
- regional constraints.
EIA tracks production, storage, imports, exports, consumption and weather because all can matter to natural-gas markets.
33. Utilities can be commodity consumers
Electric utilities may purchase:
- natural gas;
- coal;
- uranium-related fuel services;
- power from wholesale markets.
Whether higher fuel costs hurt earnings depends partly on:
- regulation;
- fuel-adjustment mechanisms;
- contracts;
- generation mix.
34. Regulated pass-through changes exposure
A regulated utility may be allowed to recover certain fuel costs from customers.
That can reduce direct commodity-margin risk.
But timing, regulatory approval and affordability still matter.
“Utility uses natural gas” is not enough analysis.
35. Copper as an industrial signal
Copper is widely used in:
- power systems;
- building wiring;
- electronics;
- transportation;
- industrial machinery.
USGS identifies electrical applications as a major share of copper use.
That broad industrial exposure is why investors often watch copper when discussing global manufacturing and infrastructure demand.
36. Copper miners and copper users see opposite first-order effects
Higher copper prices can help producers through higher realized revenue.
They can hurt copper-intensive manufacturers through higher input costs.
A power-equipment producer may enjoy booming demand while simultaneously paying more for copper.
Welcome to real-world margins.
37. Construction materials
Construction and infrastructure projects can be exposed to:
- steel;
- copper;
- aluminum;
- cement inputs;
- energy;
- lumber.
Fixed-price contracts can make sudden input inflation especially painful.
38. Contract structure can transfer commodity risk
Contracts may contain:
- fixed prices;
- cost escalators;
- commodity-index adjustments;
- fuel surcharges;
- take-or-pay provisions.
The contract can decide who gets the commodity shock.
39. Gold miners are not gold bars
A gold miner has:
- operating costs;
- mine-development risk;
- political risk;
- reserve risk;
- management decisions;
- capital expenditures.
Gold itself does not have a payroll.
The miner unfortunately does.
40. Commodity equity versus commodity exposure
Owning a producer's stock is not identical to owning the commodity.
Equity investors also own exposure to:
- company balance sheet;
- management;
- cost structure;
- taxes;
- capital allocation;
- reserves;
- valuation.
Commodity price is one large input.
It is not the entire security.
41. Commodity companies can hedge
Producers and consumers may use:
- futures;
- forwards;
- swaps;
- options;
- fixed-price contracts
to reduce commodity-price uncertainty.
This can weaken the immediate relationship between spot price and earnings.
42. Producer hedge example
Suppose an oil producer hedged part of next year's production at a fixed price.
If spot oil suddenly rises far above that price:
- unhedged production may benefit;
- hedged production may not receive the full upside.
The hedge did its job:
reduced uncertainty
It also reduced upside participation.
43. Consumer hedge example
An airline might hedge part of anticipated fuel exposure.
If fuel prices rise sharply, the hedge can partially offset higher physical fuel costs.
But hedge:
- size;
- instrument;
- basis;
- expiration
must fit the actual exposure.
44. Basis risk returns
A company may hedge one benchmark while purchasing or selling a related but different physical commodity.
The two prices can diverge.
That difference creates basis risk.
The hedge can be directionally right and financially imperfect.
45. Inventory creates another layer
Companies can hold physical inventory.
Commodity-price changes can affect:
- inventory values;
- working capital;
- financing needs;
- reported cost of goods sold;
- future margins.
The timing depends on accounting and inventory flows.
46. Rising commodity prices can consume cash
Even when a business can eventually pass costs through, it may need more cash to finance the same physical inventory at higher prices.
Working-capital requirements can increase.
Profit and cash flow are related.
They are not identical roommates.
47. Commodity-price volatility can change capital spending
Producers may reduce investment when commodity prices are weak.
That can hurt:
- oilfield services;
- mining equipment;
- engineering firms;
- industrial suppliers.
A commodity downturn can therefore hit the producer ecosystem.
48. High prices can eventually create new supply
Sustained high prices can encourage:
- new mines;
- new wells;
- substitution;
- recycling;
- efficiency improvements.
But supply responses often take time.
Copper mines are notoriously difficult to download overnight.
49. Low prices can destroy future supply
Weak prices can cause:
- project cancellations;
- lower exploration;
- mine closures;
- reduced drilling;
- producer bankruptcies.
This can eventually tighten supply.
Commodity cycles often contain the seeds of their own reversal.
50. Agricultural commodities are biological
Agricultural supply can depend on:
- planting;
- weather;
- yield;
- harvest;
- disease;
- livestock cycles.
USDA's monthly World Agricultural Supply and Demand Estimates report brings together forecasts of supply and use for major agricultural commodities.
Biology has deadlines that quarterly earnings calls cannot reschedule.
51. Fertilizer is both commodity and input
Agricultural producers can benefit from high crop prices while simultaneously facing higher:
- fertilizer;
- fuel;
- seed;
- equipment;
- labour costs.
Revenue commodity up does not mean profit automatically up by the same amount.
52. Agricultural equipment can be second-order exposure
Strong farm profitability can support demand for:
- tractors;
- combines;
- storage;
- irrigation;
- farm technology.
Commodity prices can therefore influence companies that never sell a bushel of corn.
53. Commodity prices feed inflation measures
Commodity-price changes can affect producer costs and consumer prices.
The Bureau of Labor Statistics Producer Price Index measures average changes in selling prices received by domestic producers, and BLS also publishes industry input indexes measuring price changes for inputs used by industries.
Commodity shocks can therefore appear inside broader inflation data.
54. Energy can affect many inflation channels at once
Energy influences:
- transportation;
- heating;
- electricity;
- manufacturing;
- agriculture;
- chemicals;
- distribution.
A large energy move can echo through multiple cost structures.
55. Commodity inflation can influence interest-rate expectations
If a commodity shock contributes to broader or more persistent inflation, markets may revise expectations for monetary policy.
This can affect:
- bond yields;
- equity valuations;
- currencies;
- credit conditions.
This is a second-order commodity effect.
56. A commodity shock can hurt companies with no direct commodity exposure
Imagine an expensive oil shock that raises inflation expectations and long-term interest rates.
A software company buys very little crude oil.
Its valuation can still be affected by higher discount rates.
The barrel found the software company without ever visiting the office.
57. Commodity shocks can change consumer spending
Higher fuel or food costs can reduce household disposable income available for:
- restaurants;
- travel;
- retail;
- entertainment;
- other discretionary purchases.
Commodity exposure can therefore travel through the consumer budget.
58. Lower commodity prices can be a tax cut—or a warning
Lower energy prices can improve household purchasing power and reduce business costs.
But falling commodities can also reflect:
- weak global demand;
- recession fears;
- excess supply.
The reason for the price move still matters.
59. Commodity currencies
Economies with significant commodity exports can see their currencies influenced by commodity prices and trade flows.
That can create another transmission channel into companies with:
- foreign revenues;
- foreign costs;
- foreign debt.
We go much deeper into corporate currency exposure in RW-05.
60. Geography matters
The same commodity can have different regional prices because of:
- transportation;
- storage;
- pipeline capacity;
- port access;
- local regulation;
- regional supply and demand.
A global headline price can hide a local bottleneck.
61. Quality and grade matter
Commodities are standardized enough to trade, but physical differences still matter.
Examples include:
- crude-oil sulfur and density;
- metal purity;
- wheat class;
- coal quality;
- natural-gas location and specification.
Realized prices can include premiums and discounts.
62. Substitution matters
If one commodity becomes extremely expensive, consumers may substitute:
- another material;
- another fuel;
- another ingredient;
- a more efficient process.
High prices can reduce their own demand over time.
63. Recycling matters
Higher prices can encourage more recycling and secondary supply.
USGS commodity analysis tracks recycled material because it can be an important part of supply for several metals.
The mine is not the only place metal comes from twice.
64. Commodity equities can anticipate prices
Stocks are forward-looking.
A producer's share price may rise before the commodity if investors expect:
- future shortages;
- higher demand;
- better margins.
Or the stock can fall while the commodity remains high if investors expect the boom to end.
65. Commodity price and equity price can diverge
A commodity producer's stock can underperform despite strong commodity prices because of:
- cost inflation;
- poor capital allocation;
- operational problems;
- debt;
- political risk;
- valuation;
- hedges;
- production misses.
The commodity is a driver.
The company is still a company.
66. Sector ETFs can hide mixed exposure
A sector ETF may contain:
- producers;
- processors;
- service firms;
- transporters;
- companies with very different balance sheets.
A sector label is useful.
It is not a substitute for knowing the holdings.
67. First-order versus second-order effects
First-order effect:
copper price rises → copper miner realizes higher selling price
Second-order effect:
copper price rises → electrical-equipment input costs rise → selling prices rise → inflation expectations shift → rates move → valuations change
Real markets love sequels.
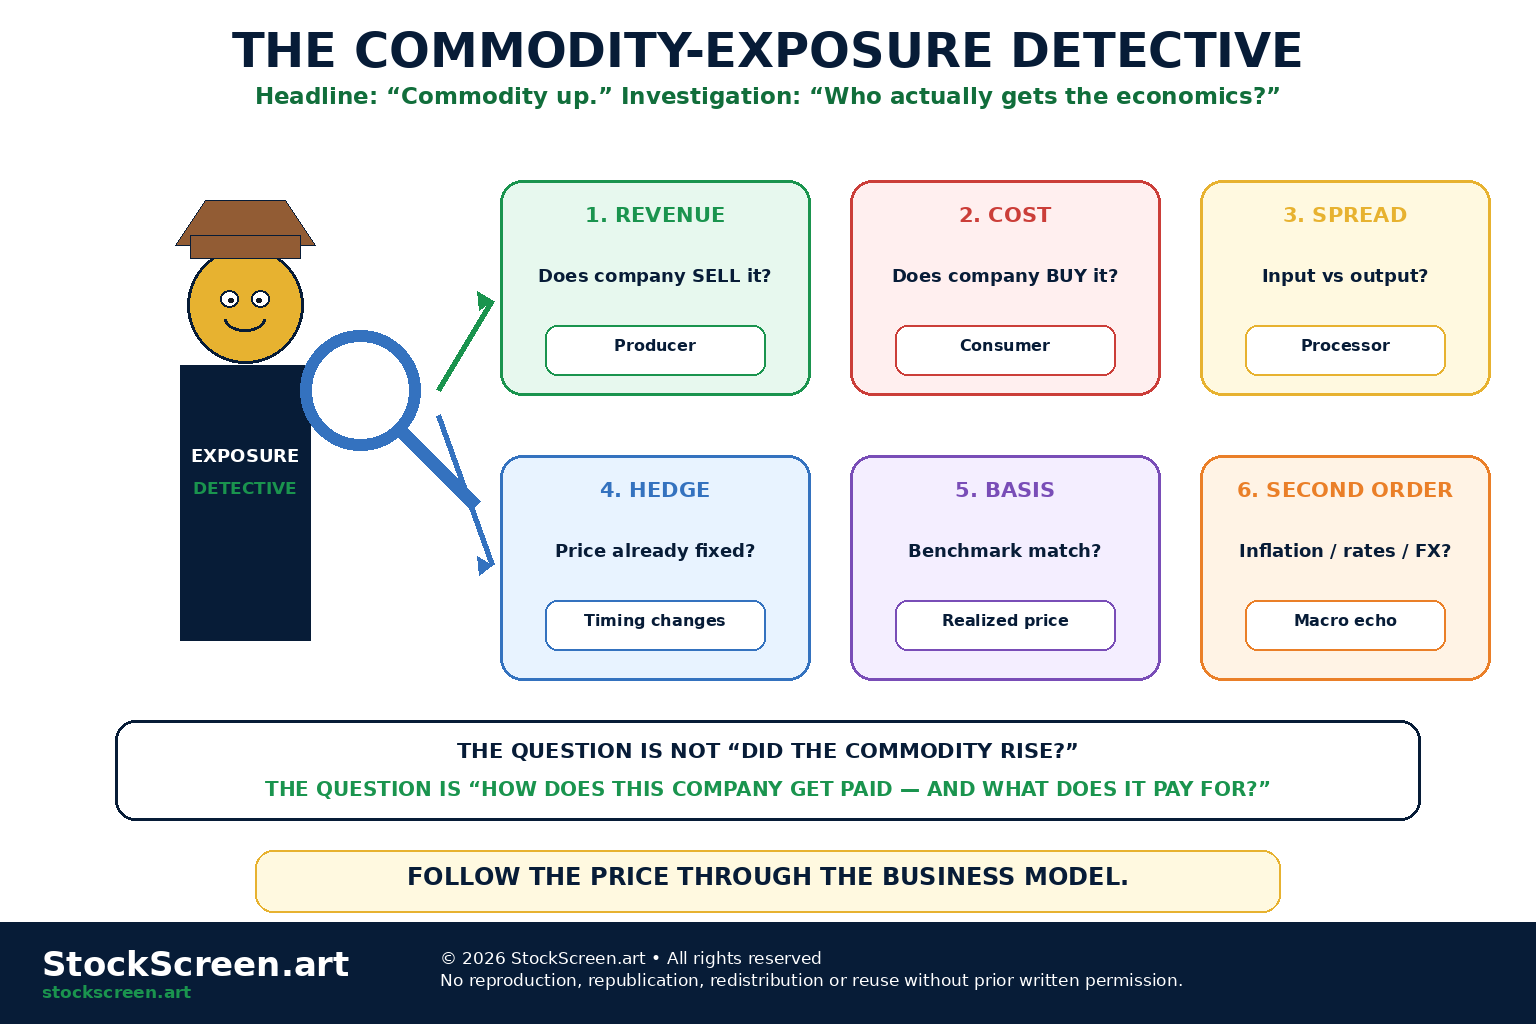
68. Commodity shock detective work
When a commodity moves sharply, ask:
- Who produces it?
- Who consumes it?
- Who processes it?
- Who transports it?
- Who can pass the cost through?
- Who hedged?
- Who has fixed-price contracts?
- What second-order macro effects might follow?
69. A company-level commodity exposure map
For any company, identify:
- Revenue commodities: what raw materials does it sell?
- Cost commodities: what does it consume?
- Realized-price basis: which benchmark actually matters?
- Volume sensitivity: how much production or consumption changes?
- Pricing power: can higher costs be passed through?
- Hedges: what price exposure has already been fixed?
- Contracts: who bears price changes?
- Inventory: how much cash is tied up?
- Capital spending: does the commodity cycle change investment plans?
- Second-order effects: what happens through inflation, rates or currencies?
70. A sector-level commodity map
| Sector / Industry | Typical Commodity Link | First Question |
|---|---|---|
| Energy producers | Oil / gas as revenue | What realized price and cost per unit? |
| Refiners | Crude input / products output | What happened to refining spreads? |
| Miners | Metal as revenue | What grade, cost and production volume? |
| Airlines / transport | Fuel as cost | How much is hedged or passed through? |
| Food companies | Agricultural inputs | Can pricing offset higher ingredients? |
| Industrials | Metals / energy as inputs | Are contracts fixed-price or indexed? |
| Utilities | Fuel / purchased power | Can regulators pass costs to customers? |
71. Do not confuse correlation with economics
A stock may historically move with oil prices.
That does not prove oil is the only economic driver.
Correlation can reflect:
- shared macro conditions;
- sector flows;
- currency movements;
- risk appetite.
Start with the business model, then test the market relationship.
72. Do not use one commodity beta forever
Exposure can change because the company:
- hedges more;
- acquires another business;
- changes production;
- changes contract terms;
- cuts debt;
- changes geography.
Commodity sensitivity is not tattooed onto the ticker.
73. A practical commodity-shock checklist
- What commodity moved?
- Why did it move: supply, demand, inventory, weather, geopolitics or policy?
- Is the company a producer, processor, transporter or consumer?
- Does the benchmark match the company's realized price?
- How large is commodity revenue or cost relative to the company?
- What is the operating leverage?
- Can costs be passed through?
- Are exposures hedged?
- What happens to working capital and capital spending?
- What second-order inflation, rate, currency or consumer effects follow?
74. Eight terrible commodity-stock conclusions
- “Oil rose, so every energy stock should rise exactly the same amount.”
- “Oil fell, therefore refiners must lose money.”
- “Copper rose 20%, therefore the copper miner's profit rises 20%.”
- “Wheat rose 30%, therefore bread prices rise 30%.”
- “The airline hedged fuel, therefore fuel prices no longer matter.”
- “This company is in Materials, so it must benefit from higher raw-material prices.”
- “The commodity and the producer stock diverged. One of the charts must be broken.”
- “I know the benchmark price, therefore I know the company's realized margin.”
75. Ten mental models worth keeping
- Commodity price can be revenue, cost, or both.
- Follow the commodity through the value chain.
- Producer profits can have strong operating leverage to price.
- Processors often care about spreads.
- Consumers care about pass-through and pricing power.
- Benchmark price and realized price can differ.
- Hedges change timing and sensitivity.
- Contracts decide who bears price risk.
- Commodity shocks create second-order macro effects.
- A commodity equity is still an operating company, not a commodity with a ticker.
Quick knowledge check
Ten questions. No barrels, bushels or metric tonnes will be physically delivered after submission.
1. Why can a commodity price increase help one company and hurt another?
The commodity may be revenue for a producer but an input cost for a consumer, while a processor may care mostly about the spread between its input and output prices.
2. What is operating leverage in a commodity producer?
When relatively fixed or slowly changing costs cause a percentage change in commodity selling price to create a larger percentage change in operating profit or cash flow.
3. Why might a producer's realized price differ from the headline benchmark?
Because of geography, quality, transportation, contract terms, hedging and local basis differences.
4. What does a crack spread represent conceptually?
The difference between crude-oil input prices and refined-product selling prices, used as an indicator of refinery margin conditions.
5. What determines whether higher commodity input costs squeeze a manufacturer's margin?
Among other factors, the size of the input-cost increase, the company's pricing power, customer demand, productivity, contracts and hedges.
6. Why does a 30% increase in wheat not imply a 30% increase in retail bread prices?
The farm commodity is only one part of the final retail cost, which also includes processing, labour, transportation, packaging, distribution and retailing.
7. How can a company hedge commodity-price exposure?
It may use futures, forwards, swaps, options or fixed-price contracts to reduce uncertainty in future selling or purchase prices.
8. What is basis risk in a commodity hedge?
The risk that the hedging benchmark and the company's actual physical price exposure do not move closely enough together.
9. Give one second-order effect of a commodity-price shock.
A large energy-price increase can raise inflation expectations, affect interest-rate expectations and therefore influence bond yields and equity valuations even outside the energy sector.
10. What is the best first question when analyzing a commodity move for a company?
Is this commodity primarily a source of revenue, an input cost, or both for this specific business?
Where we go next
Commodities showed us how a global price can travel through margins, sectors and inflation.
Next we follow another price that quietly changes corporate results while executives insist the underlying business was “strong on a constant-currency basis.”
Next:
FND-RW-05 — Currency Moves and Corporate Exposure.
We will look at translation, transaction exposure, import costs, foreign revenue, hedging and why a company can sell exactly the same number of widgets overseas and report a different amount of domestic-currency revenue.
Primary sources & further reading
- U.S. Energy Information Administration — What Drives Crude Oil Prices
- U.S. Energy Information Administration — Petroleum Product Prices and Crack Spreads
- U.S. Energy Information Administration — Factors Affecting Natural Gas Prices
- U.S. Geological Survey — Mineral Commodity Summaries
- U.S. Geological Survey — Copper Statistics and Information
- U.S. Department of Agriculture — World Agricultural Supply and Demand Estimates
- U.S. Bureau of Labor Statistics — Producer Price Index