Investing conversations tend to become very enthusiastic about return.
“This stock went up 40%.”
“That fund returned 18%.”
“My cousin bought something involving artificial intelligence, uranium and possibly a blockchain, and apparently retirement is now scheduled for Thursday.”
Return is important.
But return without risk is only half a sentence.
This lesson is about the four ideas underneath that bargain: risk, return, volatility and compounding.
1. What is return?
Return is the gain or loss produced by an investment over a period of time.
At its simplest, if you buy something for $100 and later sell it for $110, your price return is 10%.
But investments can produce return in more than one way.
Investor.gov notes that return can come from an increase in an asset's value or from income such as interest or dividends.
For a stock, total return might include:
- the change in the stock price;
- dividends received while you owned it.
For a bond, return can involve:
- interest payments;
- changes in the bond's market value;
- principal repayment if held through maturity and the issuer performs as promised.
A simple return calculation
Suppose you invest $1,000 and the investment becomes worth $1,100.
Return = ($1,100 − $1,000) ÷ $1,000 = 10%
Very straightforward.
Finance will make amends for that simplicity shortly.
2. What is risk?
Investor.gov defines risk in finance as uncertainty about an investment's return and the potential financial harm that can occur when outcomes differ from what the investor expected.
That is broader than:
“The price moved around a lot.”
An investment can expose you to many different kinds of risk.
Business risk
The company may perform poorly, lose customers, make bad decisions, face stronger competition, take on too much debt or simply discover that its supposedly revolutionary product is mainly revolutionary in the PowerPoint presentation.
Market risk
A good company can still fall because the broader market reprices risk, investors become less willing to own stocks, or economic conditions change.
Liquidity risk
You may not be able to buy or sell easily at a reasonable price. We met this particular troublemaker in Lesson 3.
Interest-rate risk
Changes in interest rates can materially affect bond prices and can also influence stock valuations.
Inflation risk
Your investment may grow in dollars while failing to keep pace with the rising cost of living.
We will examine interest rates and inflation properly in the next lesson.
3. Risk and potential return: the trade-off
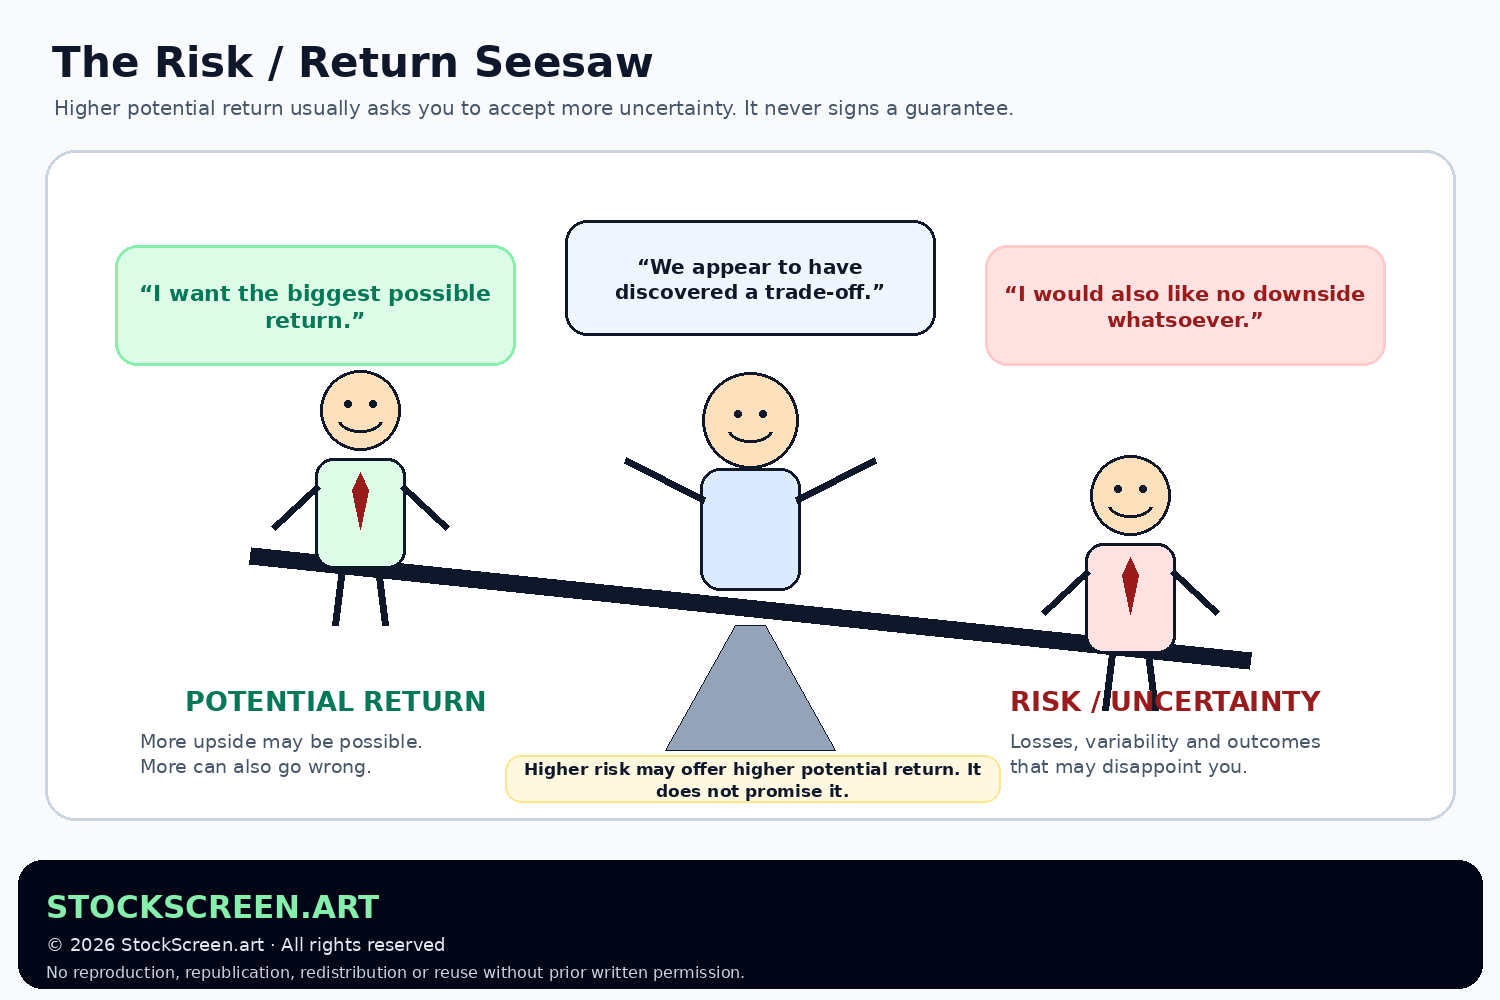
Investor.gov explains that, in general, as investment risk rises, investors seek higher returns to compensate for accepting that risk.
The key word is seek.
Higher risk does not automatically produce higher return.
Sometimes higher risk produces:
“Well, that was educational.”
The reason investors may demand a higher expected return from a risky investment is that they need an incentive to accept greater uncertainty.
If Investment A and Investment B offered exactly the same expected payoff, but Investment B had a much greater chance of losing money, most rational investors would prefer A.
B therefore has to offer something potentially better to attract capital.
4. What is volatility?
FINRA describes volatility as the degree to which market prices move up and down, with larger swings indicating higher volatility and potentially greater risk.
Imagine two investments.
Investment A moves:
+1%, −1%, +0.5%, +1.2%, −0.7%
Investment B moves:
+9%, −11%, +14%, −8%, +12%
Investment B is clearly having a more eventful week.
Its price is moving through a wider range.
That is volatility.
Volatility is not exactly the same as risk
This distinction is important.
A stock that moves sharply up and down is volatile. That volatility can create risk, especially if you may need to sell during a downturn.
But volatility is not the only form of risk.
A seemingly stable investment can still expose you to:
- credit risk;
- inflation risk;
- liquidity risk;
- fraud;
- permanent impairment of value.
And a volatile investment is not automatically a bad investment.
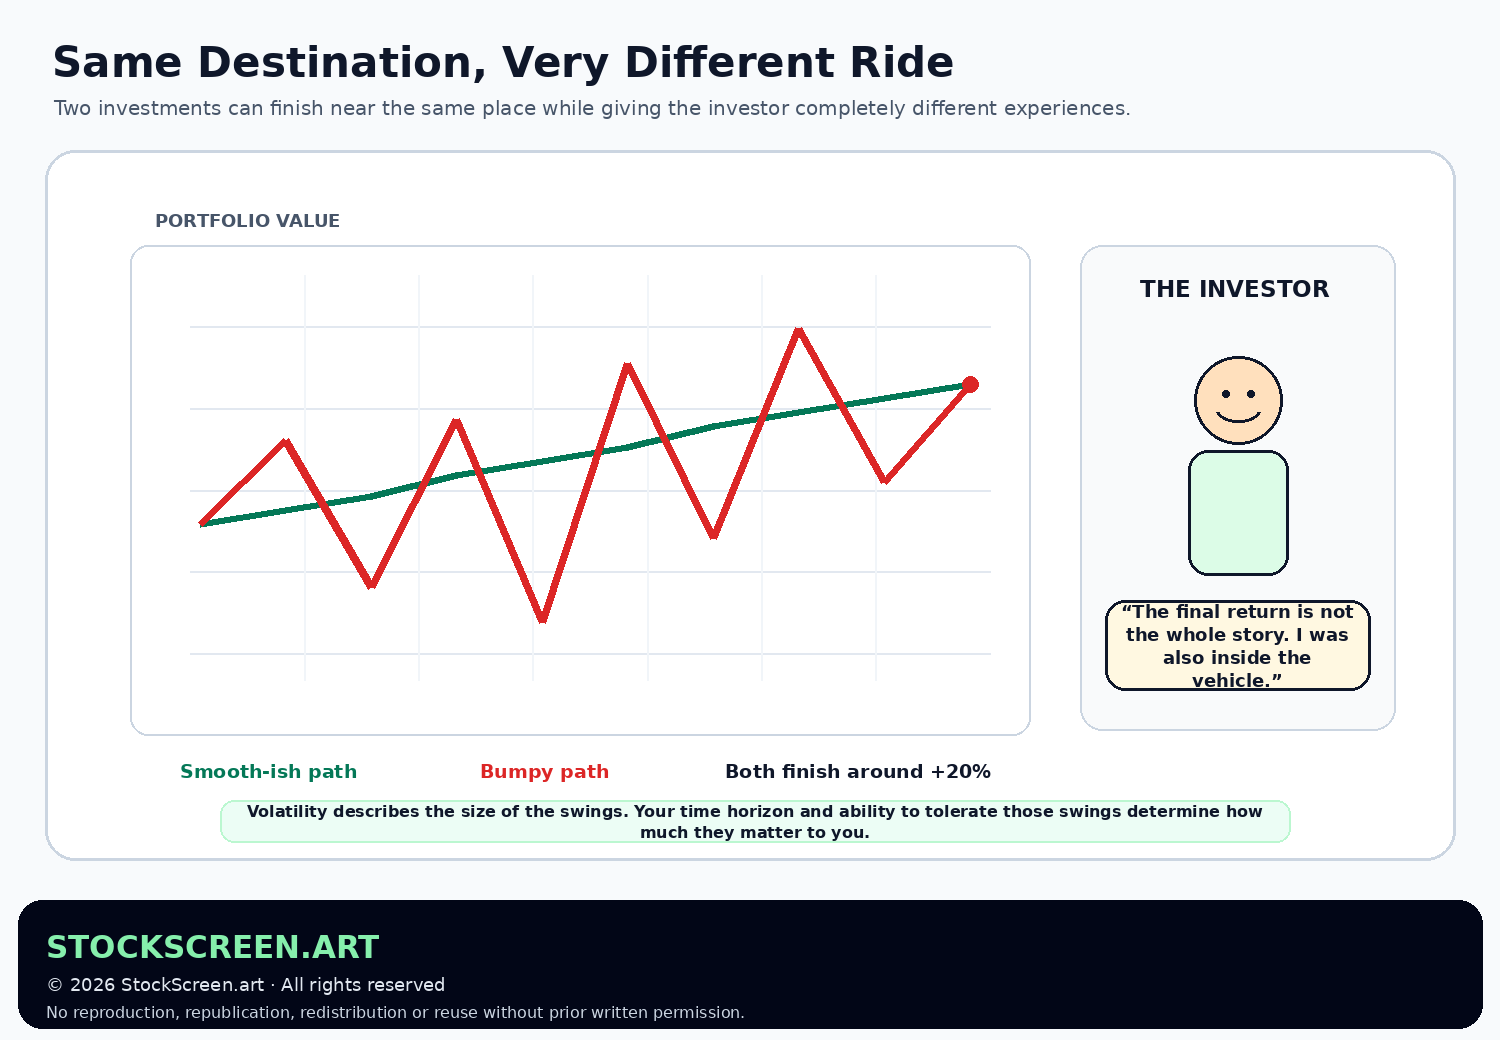
Volatility tells you something about the ride. It does not, by itself, tell you whether the destination is worthwhile.
5. How volatility is commonly measured
You will eventually encounter terms such as standard deviation, variance and beta.
We do not need to invite all of them to dinner today.
At a Foundation level, the important idea is:
Standard deviation is one common statistical way of describing how widely returns have varied around an average.
Beta, meanwhile, compares a security's historical movement with a broader market benchmark.
Both can be useful.
Neither is a crystal ball.
6. Drawdown: the loss from the peak
Investors experience volatility emotionally through something called a drawdown.
Drawdown measures how far an investment has fallen from a previous high.
Suppose a portfolio reaches $20,000 and later falls to $15,000.
Drawdown = ($15,000 − $20,000) ÷ $20,000 = −25%
A 25% drawdown means one quarter of the peak value has disappeared.
Whether that is merely uncomfortable or financially disastrous depends on why the money is invested, when it is needed, and whether the underlying investment recovers.
7. Losses and gains are not mirror images
This is one of the most useful pieces of arithmetic in investing.
If you lose 10%, you do not need exactly 10% to recover.
Why?
Because after the loss, you are working from a smaller base.
| Loss | Value of $100 After Loss | Gain Required to Return to $100 |
|---|---|---|
| −10% | $90 | +11.1% |
| −20% | $80 | +25% |
| −30% | $70 | +42.9% |
| −40% | $60 | +66.7% |
| −50% | $50 | +100% |
The 50% example deserves special attention.
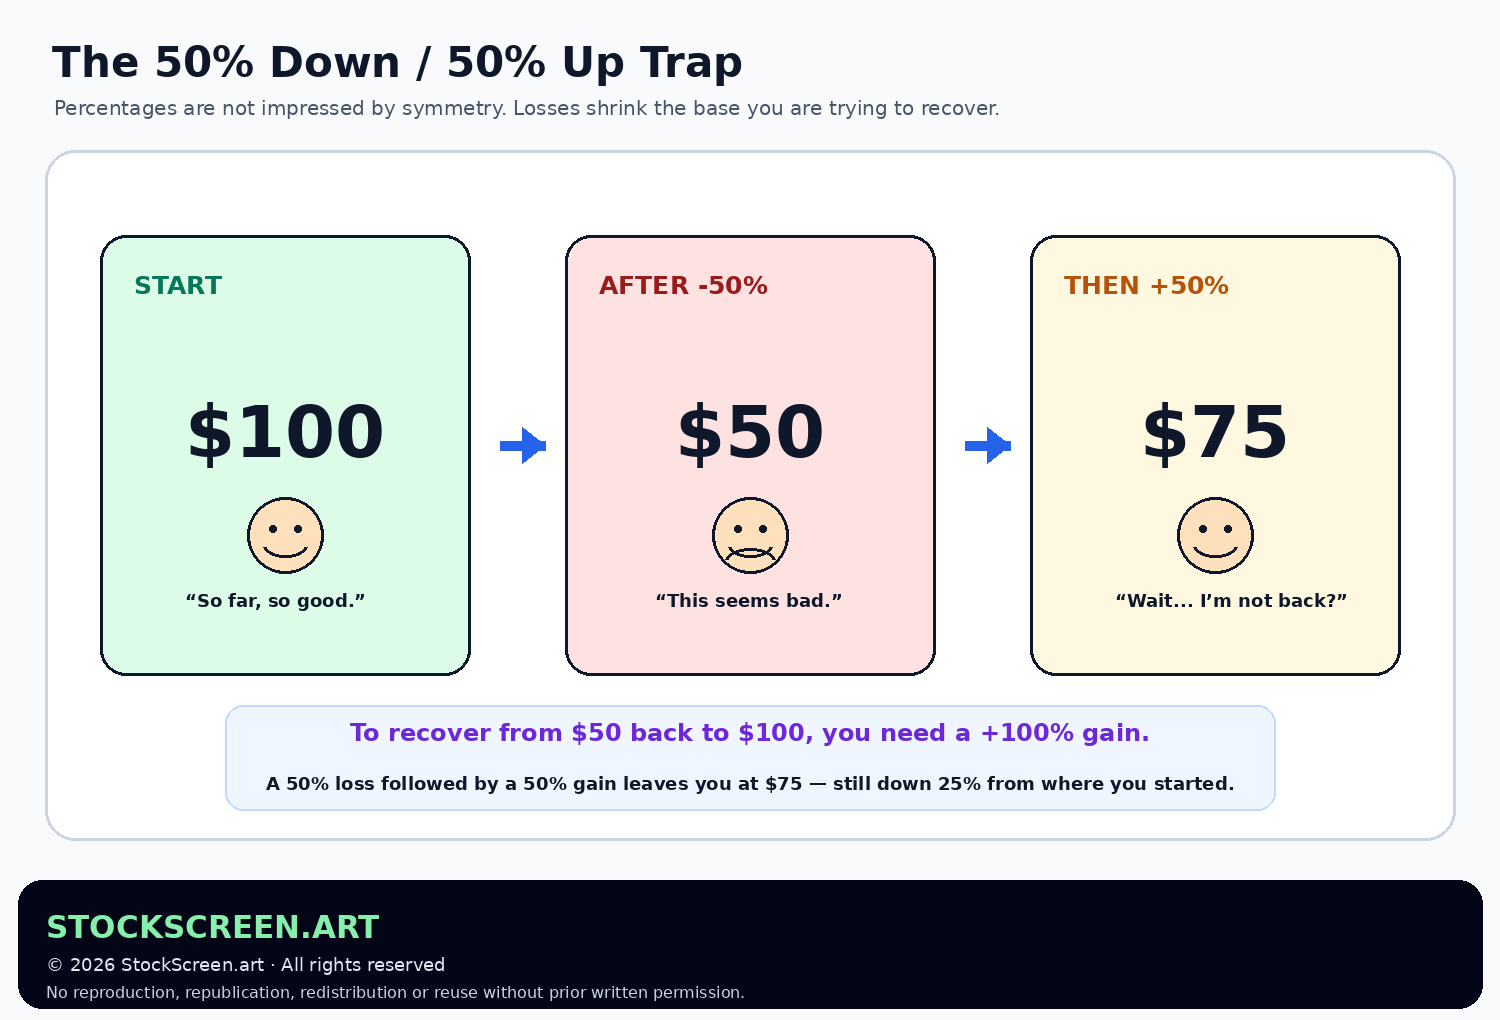
Start with $100.
Lose 50%.
You now have $50.
Gain 50%.
Fifty percent of $50 is $25.
You now have:
$75.
You are still down 25% from the original $100.
To get from $50 back to $100 requires a 100% gain.
8. This is why avoiding catastrophic losses matters
This does not mean investors should attempt to avoid every temporary decline.
That would require either supernatural market timing or never owning anything whose price changes.
It means very large losses create a mathematical recovery problem.
Losing 5% and recovering is very different from losing 70%.
At a 70% loss:
$100 becomes $30.
To return from $30 to $100 requires a gain of roughly:
233%
That is quite a hill.
The hill has opinions.
9. Compounding: returns earn returns
Investor.gov describes compound growth as earning a return on the money you invested and on the returns that money has already generated.
Suppose $1,000 grows by 10% in Year 1.
You now have:
$1,000 × 1.10 = $1,100
If it grows another 10% in Year 2:
$1,100 × 1.10 = $1,210
The second year's $100 gain is not merely another $100.
It is $110 because the return was earned on the original principal plus the first year's gain.
That is compounding.
10. Compounding works in both directions
Compounding is often introduced with cheerful upward-sloping charts.
It deserves those charts.
But the same mathematics also explains why volatility can reduce long-term growth.
Consider:
- Year 1: +20%
- Year 2: −20%
The simple arithmetic average of those two returns is:
(20% + −20%) ÷ 2 = 0%
It looks like nothing happened.
But start with $100:
- After +20%: $120
- After −20%: $96
The actual two-period compounded result is:
−4%
Arithmetic averaging said zero.
Your brokerage statement has chosen a different interpretation.
11. The geometric return: the return your money actually experienced
When returns vary over multiple periods, the compounded growth rate is often described using a geometric average rather than a simple arithmetic average.
You do not need to calculate it by hand every morning before coffee.
The conceptual lesson is enough:
That is why large swings can create what is sometimes called volatility drag: the compounded result can be lower than the simple average return suggests.
12. Time is one of compounding's favorite ingredients
Investor.gov emphasizes the importance of time in compound growth.
The reason is simple:
every additional period gives previous gains another opportunity to generate gains of their own.
Suppose $10,000 compounds at a hypothetical 7% annual rate with no additional contributions.
| Time | Approximate Value |
|---|---|
| 10 years | $19,672 |
| 20 years | $38,697 |
| 30 years | $76,123 |
| 40 years | $149,745 |
These are mathematical illustrations, not forecasts.
Real investment returns are uneven, fees and taxes can matter, and no market owes you a smooth 7% every December because a spreadsheet asked nicely.
The point is simply that time gives compounding more repetitions.
13. Risk changes when the time horizon changes
FINRA notes that volatility can mean very different things to investors with different time horizons.
Someone investing for a goal decades away may have time to tolerate substantial short-term fluctuations.
Someone who needs the money next month may not.
Consider two people holding the same volatile asset:
- Investor A does not need the money for 25 years.
- Investor B needs the money for a home purchase in six months.
The market volatility is identical.
The financial consequence of that volatility may be completely different.
14. Risk tolerance vs. risk capacity
These two ideas are related but not identical.
Risk tolerance
How comfortable are you emotionally with uncertainty and losses?
Some people see a 15% decline and think:
“Markets fluctuate.”
Others see the same decline and begin searching:
“Can stocks legally do this?”
Risk capacity
How much risk can your financial situation actually withstand?
A person may be emotionally comfortable with a very risky portfolio but still be unable to afford a large decline because the money is needed soon.
Confidence does not increase financial capacity.
It mainly increases the volume at which confidence is expressed.
15. Return should be evaluated with the path attached
Imagine two investments both turn $10,000 into approximately $12,000 over the same broad period.
Investment A gets there with modest fluctuations.
Investment B falls to $6,000, rises to $13,000, falls to $8,000, and eventually reaches $12,000.
The ending values may be similar.
The investor experience is not.
Investment B demanded:
- greater tolerance for drawdowns;
- greater ability to remain invested;
- more confidence in the underlying thesis;
- possibly more antacid.
This is why professional investment analysis often considers return together with measures of risk and drawdown, rather than awarding a trophy to whichever number is largest.
16. The danger of chasing return
High historical return attracts attention.
That is understandable.
But return is backward-looking unless you are discussing an explicit forecast, and past performance does not guarantee future results.
A security that recently rose dramatically may now have:
- a higher valuation;
- more crowded positioning;
- greater volatility;
- less favorable risk/reward;
- or exactly the same good fundamentals and continued opportunity.
The return number alone cannot answer which.
17. Why this matters for StockScreen.art
StockScreen.art deliberately separates several concepts that investors sometimes blend together.
A stock can have:
- strong momentum;
- a technically attractive trend;
- high expected upside;
- and still have unacceptable risk for a particular setup.
That is why the analysis process considers things such as volatility, expected upside, trade levels and risk/reward rather than simply asking:
“Which stock went up the most recently?”
Return is interesting.
Return relative to the risk required to pursue it is more useful.
18. Five mental models worth keeping
- Potential return is compensation for uncertainty, not payment in advance.
- Volatility describes the ride; risk describes what can go wrong.
- Large losses are mathematically expensive.
- Compounding magnifies both success and damage through a changing base.
- Time can help an investor tolerate volatility only when the money truly has time.
Quick knowledge check
Eight questions. Compound your score carefully.
1. What are two common sources of investment return?
Changes in the investment's market value and income such as dividends or interest.
2. Is volatility identical to investment risk?
No. Volatility measures the magnitude of price or return fluctuations. Risk is broader and includes the possibility of financial loss and other adverse outcomes.
3. If $100 loses 50%, how much remains?
$50.
4. What percentage gain is then required to recover from $50 to $100?
100%.
5. If $100 rises 20% and then falls 20%, where does it finish?
$96. A 20% gain takes $100 to $120; a 20% loss on $120 removes $24.
6. What is drawdown?
The decline in an investment or portfolio from a previous peak.
7. Why does time matter for compounding?
Each additional period gives earlier gains the opportunity to generate returns of their own, assuming the investment continues to grow.
8. Why might the same volatile investment be appropriate for one time horizon and dangerous for another?
An investor with a long horizon may be able to wait through temporary declines, while someone who needs the money soon may be forced to sell during a downturn.
Where we go next
Risk, return and compounding do not operate in a vacuum.
The economy continuously changes the price of money itself.
That brings us to the final lesson in the Markets & Investing Foundations module:
Interest Rates, Inflation and Market Expectations.
This is where we answer questions such as:
Why can a perfectly healthy stock fall after an interest-rate announcement? Why do bond prices care about central banks? And why does earning 4% feel considerably less exciting when everything you buy becomes 5% more expensive?
Primary sources & further reading
- Investor.gov — What Is Risk?
- Investor.gov — Introduction to Investing: Compound Growth and Managing Risk
- Investor.gov — Investment Products: Risk and Return
- Investor.gov — What Is Compound Interest?
- FINRA — Volatility