Markets move.
This is not a bug.
Unfortunately, they sometimes move with the emotional sensitivity of a shopping cart on a staircase.
Two words help us describe the experience:
- volatility — how much returns bounce around;
- drawdown — how far the portfolio has fallen from a previous peak.
1. What volatility means
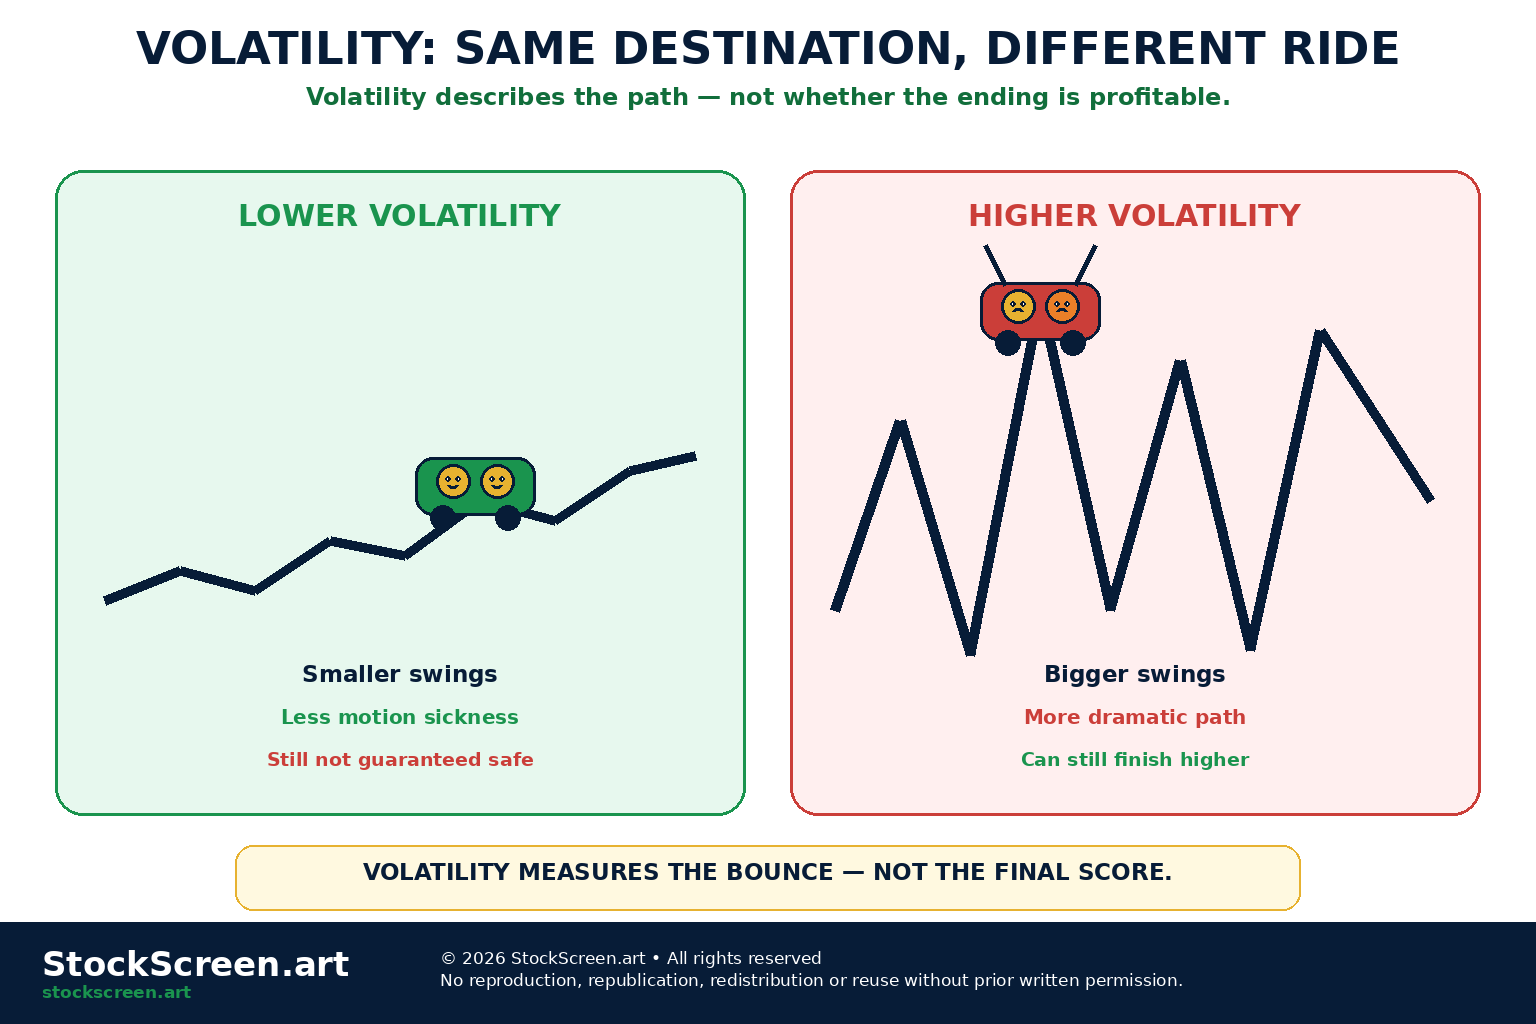
Volatility describes the degree to which an investment's price or return changes over time.
More dramatic swings generally mean higher volatility.
Smaller, steadier movements generally mean lower volatility.
FINRA describes volatility as the up-and-down movement in market indexes and securities, with more dramatic swings representing higher volatility and potential risk.
2. Volatility is not automatically bad
Volatility includes:
- large declines;
- large gains;
- rapid reversals;
- wide fluctuations around an average return.
Investors tend to complain less about upside volatility.
Nobody has ever called customer support because their portfolio rose 7% too enthusiastically.
3. Volatility is not the same as risk
Risk is broader than volatility.
Investment risk can include:
- permanent loss of capital;
- credit failure;
- liquidity problems;
- fraud;
- concentration;
- leverage;
- inflation;
- currency exposure;
- being forced to sell at a bad time.
Volatility is one way risk shows up.
It is not the entire zoo.
4. Historical or realized volatility
Historical volatility, often called realized volatility, is calculated from actual past returns.
A common method uses the standard deviation of periodic returns.
The specific result depends on:
- the return frequency;
- the length of the sample;
- the market period being measured.
5. Standard deviation intuition
Standard deviation measures how widely observations tend to spread around their average.
In return data:
- small standard deviation → returns stayed relatively close to the average;
- large standard deviation → returns were scattered more widely.
You do not need to perform the calculation by hand to understand what the statistic is trying to summarize.
6. Daily, monthly and annualized volatility
Volatility can be measured from:
- daily returns;
- weekly returns;
- monthly returns;
- other consistent intervals.
Analysts often annualize volatility to express the estimate on a yearly scale.
The assumptions behind annualization matter, especially when market behavior is not stable through time.
7. High volatility does not guarantee a loss
A highly volatile investment can finish the year higher.
A low-volatility investment can finish the year lower.
Volatility describes the path, not the final destination.
A roller coaster and an elevator can both arrive on the fifth floor.
One simply charges extra for screaming.
8. Low volatility does not guarantee safety
A security that declines slowly and steadily can have relatively modest short-term volatility while still producing a large cumulative loss.
Consider:
−1%, −1%, −1%, −1%, −1%, ...
Very orderly.
Still heading the wrong direction.
9. Upside and downside volatility
Standard deviation treats upside and downside deviations as variation.
Investors often care more about downside movement.
This is why risk analysis also uses measures focused on:
- downside deviation;
- drawdown;
- loss probability;
- tail risk.
Not all movement feels equally risky to the person paying the mortgage.
10. What drawdown means
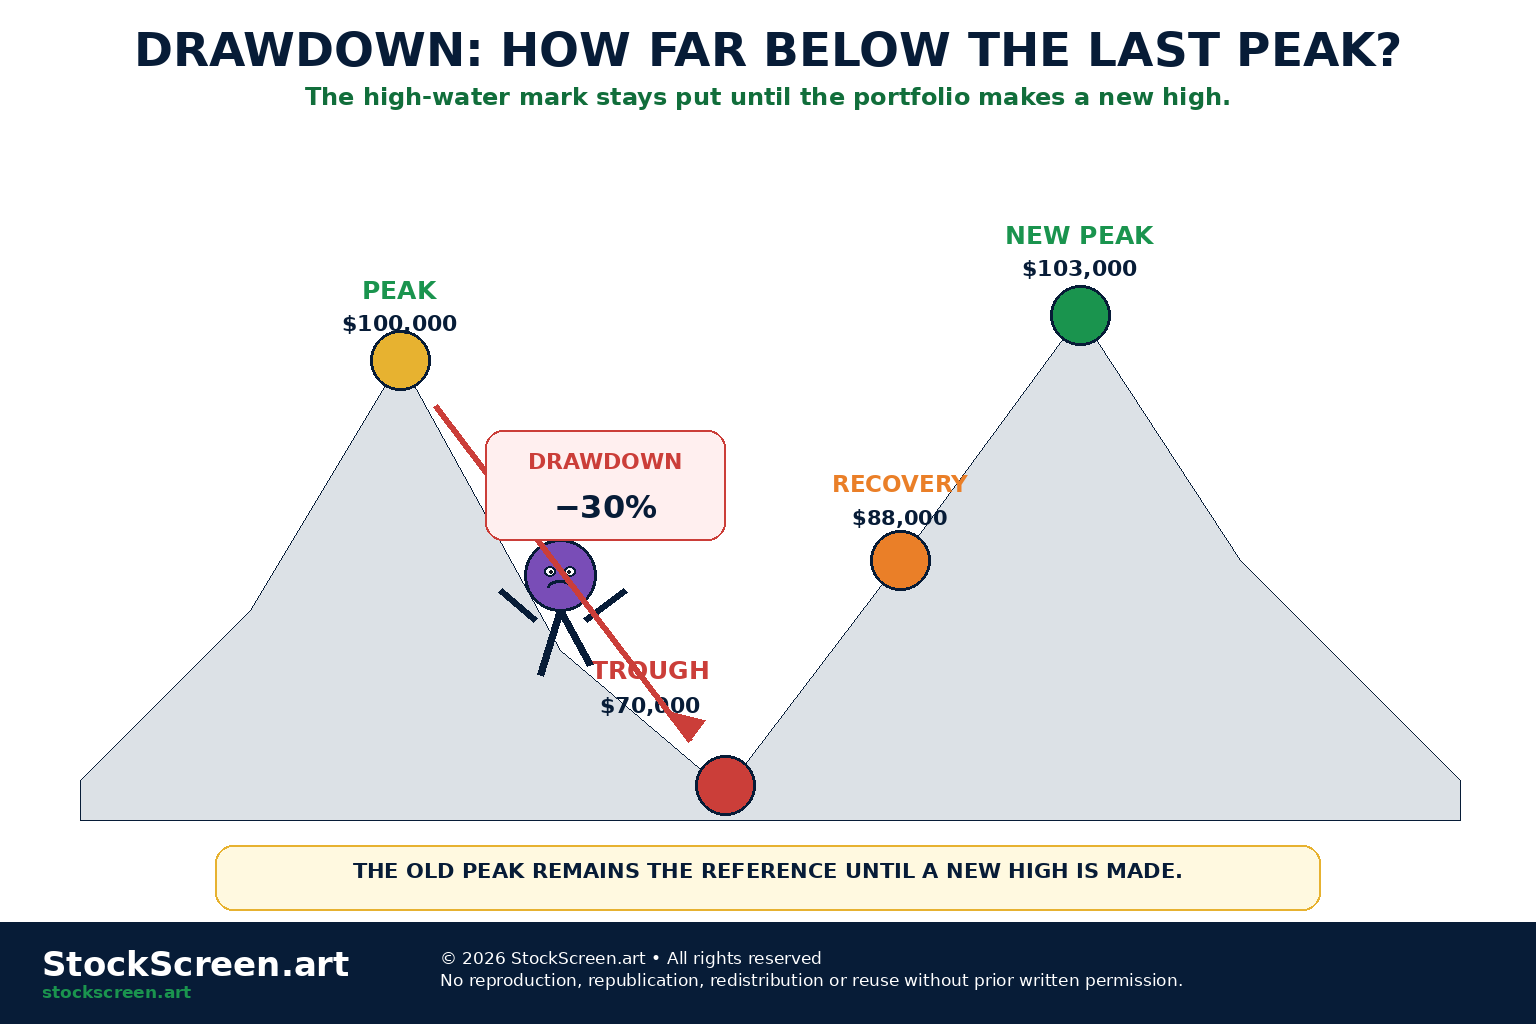
A drawdown is a decline from a prior peak in portfolio or investment value.
A simple formula is:
Drawdown = (Current Value − Previous Peak) ÷ Previous Peak
Because the current value is below the peak, the result is negative.
11. Simple drawdown example
Suppose a fictional portfolio reaches:
$100,000
and then falls to:
$80,000
Drawdown:
($80,000 − $100,000) ÷ $100,000 = −20%
The portfolio is in a 20% drawdown from its prior peak.
12. Drawdown is always measured from a peak
Suppose the portfolio falls from $100,000 to $80,000, then recovers to $90,000.
The drawdown is not measured from $80,000.
The previous peak remains $100,000.
($90,000 − $100,000) ÷ $100,000 = −10%
The portfolio is still 10% below its high-water mark.
13. A new peak resets the drawdown
Once the portfolio rises above its old peak, the old drawdown is fully recovered.
The new high becomes the reference point for future drawdowns.
Congratulations.
The mountain has issued a fresh cliff.
14. Maximum drawdown
Maximum drawdown is the largest peak-to-trough decline observed during the period being studied.
If a portfolio experiences drawdowns of:
- −8%;
- −12%;
- −27%;
- −9%;
then the maximum drawdown for that sample is:
−27%
15. Maximum drawdown depends on the sample
A strategy tested from 2015 to 2026 can have a different maximum drawdown than the same strategy tested from 2000 to 2026.
Why?
Different samples contain different crises.
A backtest that never met a difficult market has not necessarily proven bravery.
16. Drawdown duration
Drawdown severity is only one dimension.
Investors may also care about duration:
How long has the portfolio remained below its previous peak?
A 15% drawdown that recovers in three weeks can feel very different from a 15% drawdown that lasts three years.
17. Time underwater
The phrase time underwater is often used informally to describe the period between falling below a previous peak and finally reaching a new high.
A portfolio can be:
- only modestly below the old peak;
- but stuck there for a very long time.
Patience has a duration component.
18. Recovery math is asymmetric
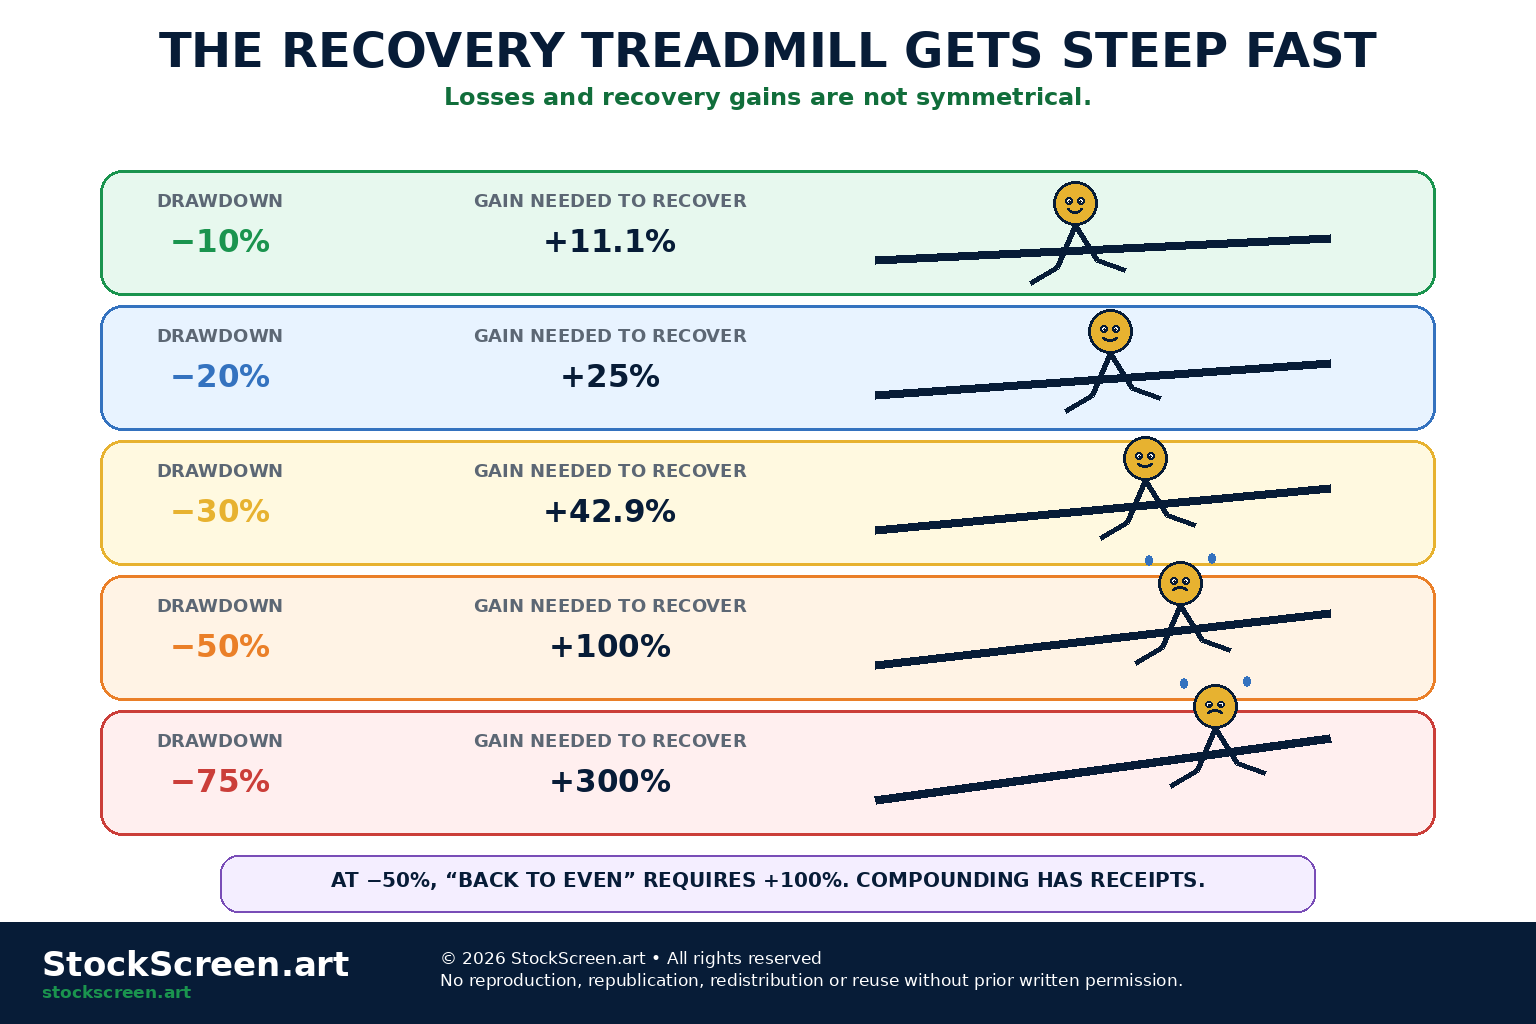
If a portfolio loses 10%, it does not need a 10% gain to recover.
Why?
The gain is earned on a smaller base.
| Drawdown | Value Remaining | Gain Needed to Recover |
|---|---|---|
| −10% | 90% | +11.1% |
| −20% | 80% | +25% |
| −30% | 70% | +42.9% |
| −50% | 50% | +100% |
| −75% | 25% | +300% |
19. Why a 50% loss requires a 100% gain
Start with:
$100
Lose 50%:
$50
A 50% gain on $50 produces:
$75
To return from $50 to $100 requires:
+100%
Drawdown math has no loyalty program.
20. Drawdowns create path dependence
Investment outcomes depend on the order in which returns occur because each return applies to the portfolio value left after earlier returns.
Example:
- Year 1: +20%;
- Year 2: −20%.
Start with $100:
$100 → $120 → $96
The arithmetic average return is 0%.
The compounded outcome is −4%.
21. Why +20% and −20% do not cancel
The second percentage is applied to a different base.
This is the same reason recovery gains become larger after losses.
22. Volatility can create compounding drag
When returns vary widely around an average, the geometric or compounded return can be lower than the arithmetic average return.
This is sometimes called volatility drag.
It does not mean volatility is a fee deducted by the exchange.
It is a consequence of compounding on changing capital.
23. Sequence matters especially when money is leaving the portfolio
Investors taking withdrawals can be especially sensitive to the order of returns.
Large losses early in a withdrawal period can force withdrawals from a reduced capital base.
This can make recovery harder even if long-run average returns eventually look acceptable.
This is commonly called sequence-of-returns risk.
Detailed retirement planning is beyond the scope of this lesson, but the principle is worth recognizing.
24. Drawdown versus realized loss
A drawdown can exist even when the investor has not sold.
If a portfolio falls from $100,000 to $80,000, the account is in a 20% drawdown whether or not the positions have been closed.
Selling determines realization for accounting or tax purposes.
The economic decline already happened.
25. Drawdown versus permanent capital loss
Some drawdowns recover.
Some do not.
A broad diversified market decline may eventually recover over time.
A failed company can fall permanently.
Drawdown describes the path.
Permanent capital loss describes an outcome.
26. Why investors care about drawdown more than spreadsheets do
A model may say:
“Expected long-run return remains attractive.”
The investor may say:
“My account is down 38% and I have discovered several new emotions.”
Risk tolerance has both:
- financial capacity;
- behavioral tolerance.
27. Volatility can change investor behavior
High volatility can cause investors to:
- sell after declines;
- buy after rallies;
- abandon a plan;
- check the account every nineteen seconds;
- replace strategy with improvisation.
A theoretically optimal portfolio is not useful if the investor cannot stick with it.
28. Risk tolerance is not a bravery contest
Investor.gov describes risk tolerance in terms of both ability and willingness to lose money in pursuit of potential return.
The correct portfolio is not the one with the maximum amount of discomfort you can technically survive.
“I did not sleep for eight months, but the Sharpe ratio was excellent” is not a wellness plan.
29. Volatility changes through time
Markets do not maintain one stable volatility level forever.
Calm periods can be followed by turbulent periods.
Turbulent periods can eventually settle.
Therefore a volatility estimate belongs to a particular sample and regime.
30. Volatility clustering
Financial returns often show volatility clustering: large moves tend to occur near other large moves, while quiet periods often contain more quiet observations.
In plain English:
Market drama sometimes travels in groups.
This is one reason recent volatility can matter when sizing short-horizon risk.
31. Volatility regimes
Investors sometimes describe markets as being in:
- low-volatility regimes;
- normal-volatility regimes;
- high-volatility or stressed regimes.
The labels are simplifications.
The useful idea is that market behavior changes through time.
32. Implied volatility
Implied volatility is inferred from option prices.
It reflects the level of future variability embedded in market option pricing, given an option-pricing framework and other inputs.
It is not the same thing as future realized volatility.
33. Implied volatility is not a direction forecast
High implied volatility does not mean:
“The market predicts stocks will crash.”
It means option prices are consistent with a higher level of expected variability, all else equal.
The direction of the move is a separate question.
34. The VIX
The Cboe Volatility Index, commonly called the VIX, is derived from S&P 500 option prices and is widely used as a measure of the market's pricing of near-term expected stock-market volatility.
It is sometimes nicknamed the “fear gauge.”
That nickname is memorable.
The actual calculation is considerably less emotional.
35. VIX is not your portfolio's volatility
Your portfolio may contain:
- small caps;
- international stocks;
- bonds;
- options;
- commodities;
- cash.
Therefore the VIX does not directly tell you how volatile your own portfolio is.
It is a market indicator, not a personalized risk thermometer.
36. Concentration magnifies drawdown
From PR-01 and PR-03, we know that one oversized position can dominate portfolio behavior.
Suppose:
- one stock = 40% of the portfolio;
- the stock falls 50%;
- everything else is unchanged.
Approximate portfolio impact:
40% × −50% = −20%
One holding just created a 20-percentage-point portfolio loss.
37. Correlation can deepen drawdowns
From PR-02, we know that related positions can fall together.
A portfolio containing several growth-sensitive assets may experience a much larger drawdown if those assets become highly correlated during stress.
Five positions are not comforting if they all use the same trapdoor.
38. Leverage magnifies volatility at the account level
Leverage does not make the underlying market more volatile.
It magnifies the account impact of that volatility.
A 3% market move under substantial leverage can become a much larger percentage move in portfolio equity.
This can accelerate drawdowns and margin pressure.
39. Margin calls can turn drawdown into forced action
Leveraged accounts may have maintenance requirements.
If equity falls far enough, the investor may face:
- margin calls;
- forced liquidation;
- reduced flexibility;
- realization of losses at unfavourable prices.
A drawdown becomes more dangerous when the investor loses the ability to wait.
40. Liquidity can make drawdowns worse
During stressed markets, spreads can widen and market depth can shrink.
Investors attempting to sell may receive worse prices than expected.
Therefore historical drawdowns from closing prices can understate the practical difficulty of exiting a large illiquid position.
41. Gaps compress time
A stock can close at $100 and reopen at $80.
The 20% drawdown arrived without visiting every intermediate price while the market was open.
Stops cannot guarantee protection against this kind of jump.
Markets occasionally use the stairs.
Sometimes they use the window.
42. Diversification can reduce drawdown severity
Diversification cannot guarantee protection during broad market declines.
But reducing dependence on one company, sector or risk factor can help prevent a narrow shock from dominating the entire portfolio.
Diversification is not anti-volatility magic.
It is anti-single-point-of-failure engineering.
43. Position sizing is a drawdown control
The previous lesson emphasized that size controls impact.
If one position is small enough, even a severe loss may remain manageable at the portfolio level.
Position limits therefore help constrain potential drawdown from isolated mistakes.
44. Rebalancing can alter future drawdown exposure
When one asset grows into an oversized weight, future portfolio drawdown becomes more dependent on that asset.
Rebalancing can restore intended exposure.
We will cover that process in PR-06.
45. Maximum drawdown is useful—but incomplete
Two strategies can both have a maximum drawdown of 20%.
Strategy A:
- falls 20% once;
- recovers in two months.
Strategy B:
- falls 20%;
- remains below the peak for four years.
Same maximum drawdown.
Very different investor experience.
46. Average drawdown matters too
A strategy may have:
- one rare severe drawdown;
- or frequent smaller drawdowns.
Frequency, depth and duration all matter.
One statistic rarely captures every way a portfolio can annoy its owner.
47. Recovery speed matters
A portfolio that recovers quickly restores:
- capital;
- compounding base;
- investor confidence.
A slow recovery creates opportunity cost because the portfolio spends longer below its prior peak.
48. Compare drawdowns with the benchmark carefully
A portfolio falling 18% when its benchmark falls 35% may show meaningful downside resilience.
A portfolio falling 18% while its benchmark falls 5% tells a different story.
Context matters.
“Down 18%” is not a complete performance sentence.
49. Drawdown tolerance should be tested before the drawdown
Ask before investing:
- What decline could this portfolio plausibly experience?
- Would I need the money during that period?
- Would leverage force action?
- Would I abandon the plan?
- Would a 30% decline change my financial goals?
Risk tolerance discovered at the bottom of the drawdown is expensive research.
50. Scenario analysis
Simple scenarios can make risk tangible.
Examples:
- What if equities fall 25%?
- What if my largest stock falls 50%?
- What if correlations rise?
- What if volatility doubles?
- What if a leveraged position gaps?
- What if recovery takes three years?
The goal is not to predict the exact crisis.
It is to discover whether the portfolio survives several plausible bad ones.
51. A practical volatility review
Ask:
- How volatile has the portfolio been?
- What return frequency and sample period were used?
- Has volatility changed recently?
- Which holdings contribute most to the fluctuations?
- Is leverage magnifying the account effect?
- Does the observed volatility match my tolerance and horizon?
52. A practical drawdown review
Ask:
- What is the current drawdown from the latest peak?
- What has the historical maximum drawdown been?
- How long did past drawdowns last?
- Which holdings caused the deepest losses?
- Did correlations rise during stress?
- Could liquidity or leverage make the next drawdown worse?
- How large a gain would be required to recover?
53. Eight terrible volatility conclusions
- “Low volatility means no risk.”
- “High volatility means the investment must lose money.”
- “The VIX is high, therefore every stock must fall.”
- “This strategy only had a 12% maximum drawdown in a three-year backtest, therefore 12% is the worst possible outcome.”
- “A 50% loss only needs a 50% recovery.”
- “I have not sold, therefore the drawdown is not real.”
- “Volatility was low last month, so leverage is safer now.”
- “My risk tolerance is high because the market is currently going up.”
54. Ten mental models worth keeping
- Volatility describes fluctuation; drawdown describes distance below a prior peak.
- Volatility is one dimension of risk, not the definition of risk.
- Maximum drawdown belongs to a historical sample, not the future.
- Depth and duration both matter.
- Losses and recovery gains are asymmetric.
- Return order matters because compounding is path dependent.
- Volatility changes through regimes and often clusters.
- Concentration, correlation and leverage can amplify drawdown.
- Liquidity can turn theoretical risk into worse real execution.
- A survivable portfolio is more useful than an optimal portfolio you cannot hold.
Quick knowledge check
Ten questions. No roller-coaster height requirement.
1. What does volatility measure?
The degree to which prices or returns fluctuate over a chosen period.
2. Is volatility the same thing as investment risk?
No. Volatility is one dimension of risk, while investment risk also includes permanent loss, liquidity, leverage, credit, concentration and other uncertainties.
3. A portfolio falls from $100,000 to $80,000. What is the drawdown?
20%, calculated from the previous peak.
4. What is maximum drawdown?
The largest observed peak-to-trough decline during the period being studied.
5. How much must a portfolio gain after a 50% loss to return to its starting value?
100%.
6. Why do +20% and -20% returns not cancel?
Because each percentage applies to a different portfolio value. Starting at $100, +20% creates $120, and then -20% leaves $96.
7. What is drawdown duration?
The amount of time the investment or portfolio remains below its previous peak before recovering to a new high.
8. What is implied volatility?
A level of expected future variability inferred from option prices under an option-pricing framework. It is not the same as future realized volatility.
9. Why can leverage make drawdowns more severe?
Because leverage magnifies the impact of underlying market moves on account equity and can also create margin pressure or forced liquidation.
10. Why is historical maximum drawdown not a guaranteed future worst case?
Because it only describes the largest drawdown observed in the historical sample. Future market conditions can be more severe.
Where we go next
We now understand:
- diversification;
- correlation;
- position sizing;
- volatility;
- drawdown.
Next we put those ingredients into one of the most influential frameworks in portfolio finance:
FND-PR-05 — Modern Portfolio Theory.
This is where expected return, volatility and correlation meet on the same spreadsheet and begin arguing about the efficient frontier.
There will be graphs.
The graphs have been warned.
Primary sources & further reading
- FINRA — Volatility
- FINRA — Key Terms for Tough Times: The Vocabulary of Stressed Markets
- Investor.gov — What Is Risk?
- Investor.gov — Gauge Your Risk Tolerance
- Investor.gov — Diversify Your Investments
- Cboe — VIX Volatility Index