We have reached the part of valuation where the spreadsheet begins developing self-esteem.
It has rows.
It has formulas.
It has decimals.
It may eventually announce:
“Intrinsic value: $19.263483 per share.”
Please resist the urge to believe the sixth decimal place.
A discounted cash flow model, or DCF, is one of the most powerful ways to think about business value. It is also one of the easiest ways to make uncertain assumptions look suspiciously official.
An asset is worth the present value of the cash it can generate for its investors in the future.
NYU Stern professor Aswath Damodaran describes discounted cash flow valuation using exactly this core logic: expected cash flows are discounted at a rate that reflects their risk.
1. Why future cash is worth less than cash today
Imagine two offers:
- $100 today;
- $100 five years from now.
They are not economically identical.
The $100 available today can be:
- invested;
- used to repay debt;
- spent;
- held for another opportunity.
Waiting also introduces uncertainty.
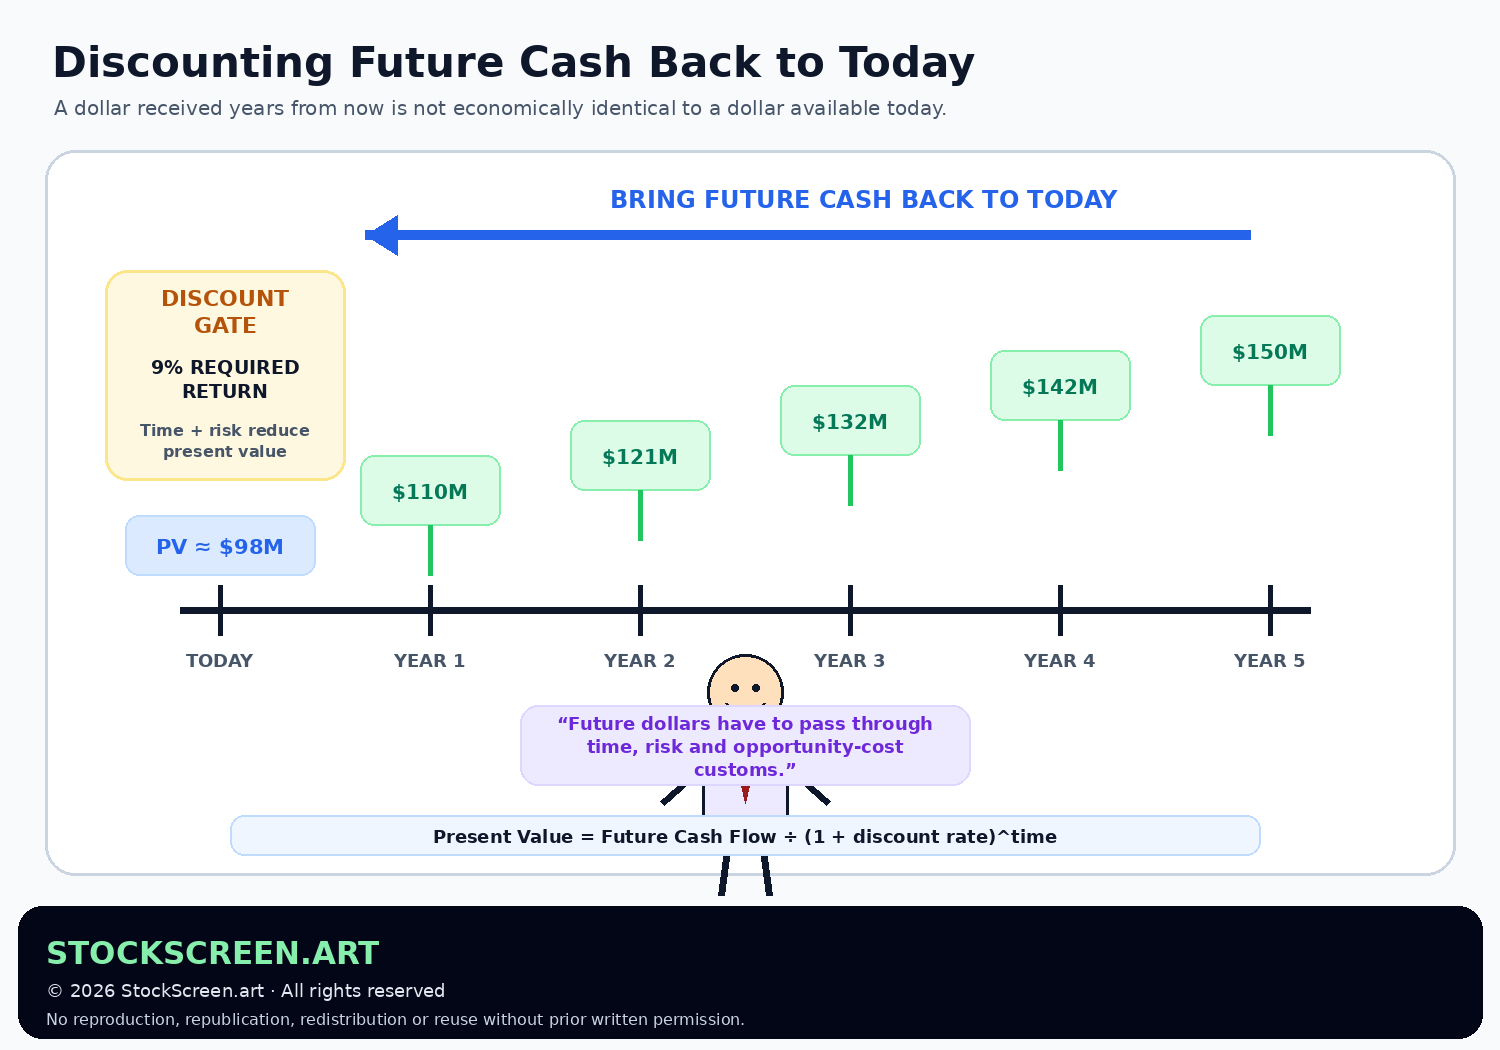
Investor.gov explains present value as the amount of money needed today to obtain a future stream of payments, based on a periodic rate of return.
In a DCF, we apply the same idea to expected business cash flows.
2. The present-value formula
The basic mathematics is:
Present Value = Future Cash Flow ÷ (1 + discount rate)time
Suppose you expect $110 one year from now and require a 10% return.
$110 ÷ 1.10 = $100 today
If the $110 arrives two years from now:
$110 ÷ 1.10² ≈ $90.91 today
Same future cash.
Longer wait.
Lower present value.
3. The discount rate is not a punishment
The discount rate represents the return investors require for committing capital to cash flows with a particular level of risk.
Higher-risk expected cash flows generally require a higher discount rate.
Higher discount rate:
lower present value, all else equal.
Lower discount rate:
higher present value, all else equal.
This connects directly to our earlier lesson on interest rates.
4. Which cash flow are we discounting?
There is more than one legitimate DCF framework.
At Foundation level, the most useful distinction is:
Free Cash Flow to the Firm — FCFF
FCFF represents cash flow available to the providers of both debt and equity capital after operating expenses, taxes and necessary reinvestment.
A firm-level DCF typically discounts FCFF at the company’s weighted average cost of capital, or WACC.
The result is an estimate of enterprise value.
Free Cash Flow to Equity — FCFE
FCFE focuses on cash flow available to common shareholders after considering debt-related cash flows.
An equity DCF generally discounts FCFE using the cost of equity.
The result is an estimate of equity value directly.
Firm cash flow → firm discount rate.
Equity cash flow → equity discount rate.
Mixing them is not diversification.
It is a valuation error.
5. We will use FCFF for the lesson example
To keep the mechanics clear, our fictional company will use:
- Free Cash Flow to the Firm;
- a WACC discount rate;
- a five-year explicit forecast;
- a stable-growth terminal value.
This is not the only DCF design.
It is a useful way to learn the architecture.
6. What is WACC?
Weighted Average Cost of Capital combines the required returns of the company’s major capital providers, weighted by their relative importance in the capital structure.
At a simplified conceptual level:
WACC reflects the required return demanded by equity investors and debt investors.
Debt receives an adjustment for the tax effect of deductible interest where applicable.
The full formula belongs in a more advanced lesson.
For now, remember:
7. The five major building blocks of a simple DCF
- Forecast future free cash flows.
- Choose an appropriate discount rate.
- Discount each forecast cash flow to present value.
- Estimate terminal value.
- Discount terminal value and add everything together.
Then, if the model produced enterprise value, bridge from enterprise value to common-equity value.
8. Forecasting free cash flow
Suppose fictional XYZ generated approximately $100M of FCFF recently.
Based on its revenue, margins, reinvestment needs and growth opportunities, our hypothetical forecast is:
| Year | Forecast FCFF |
|---|---|
| 1 | $110M |
| 2 | $121M |
| 3 | $132M |
| 4 | $142M |
| 5 | $150M |
Notice what we did not do:
“Revenue has grown 20%, so obviously it will grow 20% forever.”
Large companies run into:
- competition;
- market saturation;
- slower industry growth;
- capital requirements;
- mathematics.
Growth normally has to fade toward a sustainable long-term rate.
9. Forecast the business, not the spreadsheet
A good forecast usually starts with business drivers.
Revenue can be thought about using:
- customer growth;
- unit volume;
- pricing;
- market share;
- new products;
- market expansion.
Margins depend on:
- pricing power;
- input costs;
- operating leverage;
- competition;
- business mix.
Free cash flow also depends on:
- capital expenditures;
- working capital;
- taxes;
- reinvestment required to support growth.
A DCF is not improved by forecasting 19 separate lines if none of them has an economic reason.
10. Discount the explicit cash flows
Assume XYZ’s WACC is 9%.
Each future FCFF is discounted using:
FCFF ÷ (1.09)year
Our approximate results are:
| Year | FCFF | Present Value at 9% |
|---|---|---|
| 1 | $110M | $100.9M |
| 2 | $121M | $101.8M |
| 3 | $132M | $101.9M |
| 4 | $142M | $100.6M |
| 5 | $150M | $97.5M |
The five explicit cash flows contribute approximately:
$502.8M of present value.
11. But the business does not disappear after Year 5
Our spreadsheet stops forecasting individual years after Year 5.
XYZ presumably does not receive the memo and dissolve.
We therefore need to estimate the value of cash flows occurring after the explicit forecast.
That is the terminal value.
12. Terminal value using stable growth
Damodaran describes stable-growth terminal value using a perpetuity-growth framework.
A common formula is:
Terminal Value = Next Year’s FCFF ÷ (WACC − stable growth rate)
Suppose:
- Year 5 FCFF = $150M
- Stable growth = 3%
- WACC = 9%
Year 6 FCFF becomes:
$150M × 1.03 = $154.5M
Terminal value at the end of Year 5:
$154.5M ÷ (9% − 3%) = $2.575B
13. Two rules before touching the terminal-growth formula
First:
If your perpetual growth assumption approaches or exceeds the discount rate, the formula becomes economically unstable or nonsensical.
Second:
A business cannot realistically grow faster than the economy forever while remaining a finite part of that economy.
Stable growth needs to be boring.
Terminal value is not the place to express optimism with fireworks.
14. Now discount terminal value too
The $2.575B terminal value exists at the end of Year 5.
It is not worth $2.575B today.
Discount it back five years at 9%:
$2.575B ÷ 1.095 ≈ $1.674B
Add that to the present value of our five explicit cash flows:
$502.8M + $1.674B ≈ $2.176B enterprise value
15. The terminal value problem
In our example, discounted terminal value represents roughly 77% of calculated enterprise value.
That is not unusual for long-lived businesses.
It is also a warning.
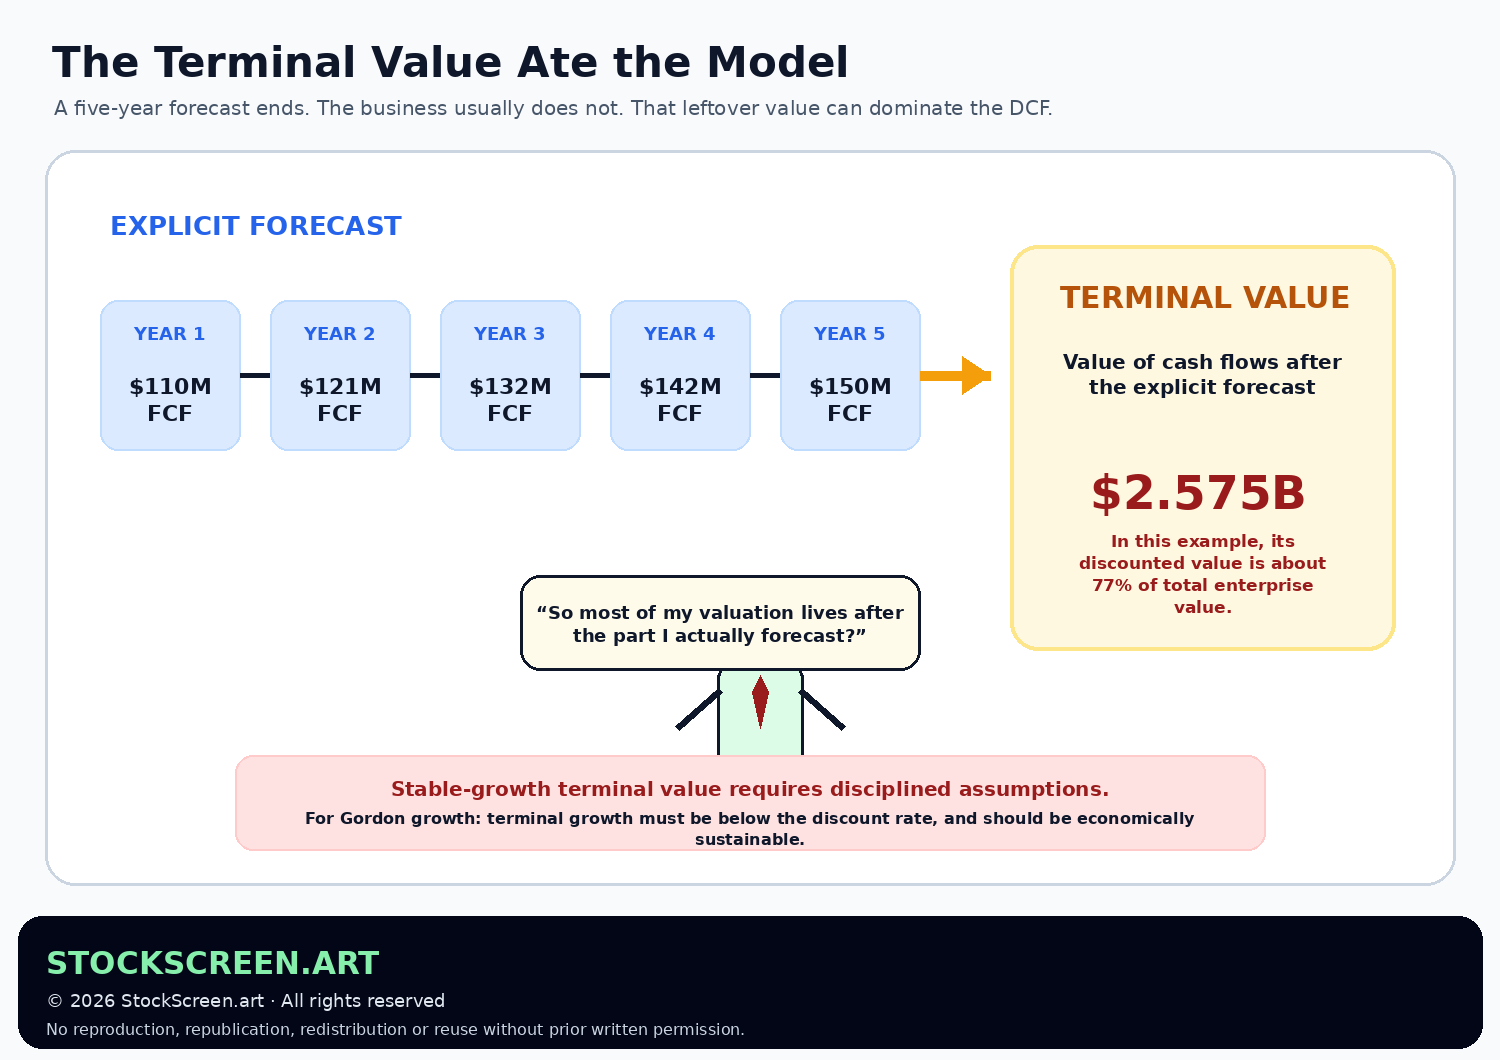
If terminal value dominates the DCF, small changes in:
- terminal growth;
- discount rate;
- final-year margins;
- final-year cash flow;
can materially change the result.
16. Enterprise value is not yet the common-stock value
Our FCFF model produced enterprise value.
We still need to account for financing claims and non-operating cash.
A simplified bridge is:
Equity Value ≈ Enterprise Value − Debt + Cash
Suppose XYZ has:
- Enterprise value: $2.176B
- Debt: $400M
- Cash: $150M
Simplified equity value:
$2.176B − $400M + $150M ≈ $1.926B
Professional valuation bridges may adjust for additional items such as preferred stock, noncontrolling interests, investments, leases or other claims/assets.
Foundation rule:
17. From equity value to value per share
Suppose XYZ has 100M diluted shares.
$1.926B ÷ 100M ≈ $19.26 per share
The model has produced an estimate.
Not a prophecy.
Not a guarantee.
Not a legally binding instruction to the stock market.
18. Why diluted shares matter
If options, restricted stock units, convertibles or other securities can increase common shares, using only the simplest current basic share count can overstate value per share.
The exact diluted-share treatment can become technical.
The basic principle is simple:
Value belongs to all of the shares that realistically participate in that equity value.
19. Sensitivity analysis: the part that keeps the model honest
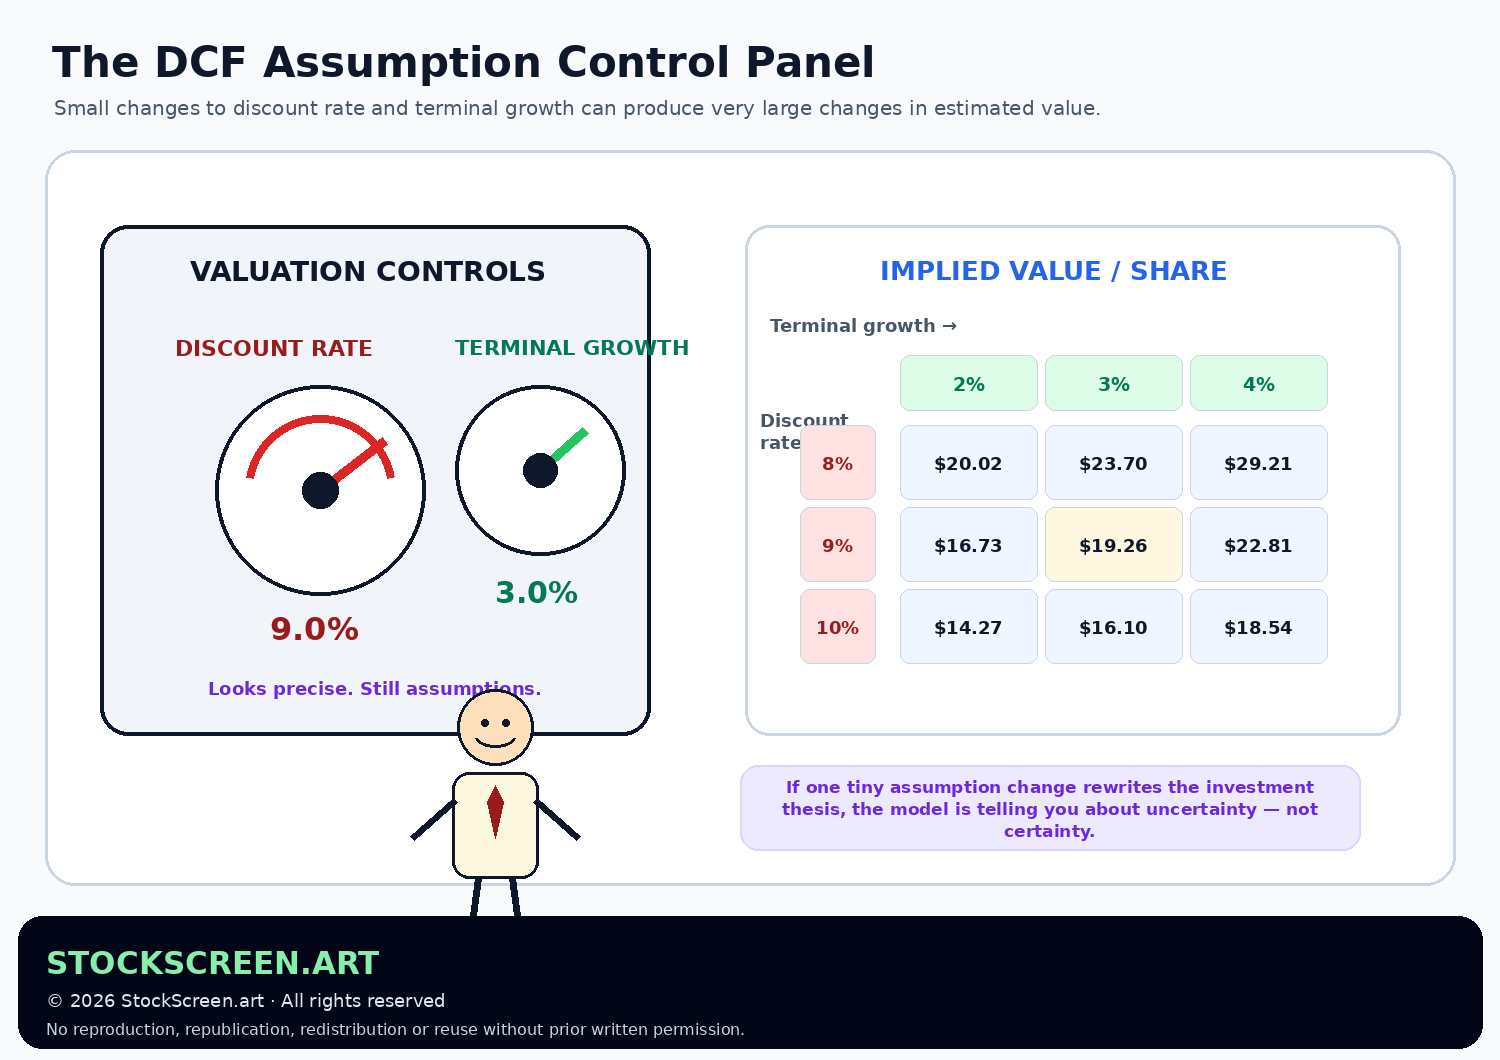
A DCF should rarely be presented as one unquestionable number.
Instead, vary important assumptions.
For the same XYZ model:
| Discount Rate | 2% Terminal Growth | 3% Terminal Growth | 4% Terminal Growth |
|---|---|---|---|
| 8% | $20.02 | $23.70 | $29.21 |
| 9% | $16.73 | $19.26 | $22.81 |
| 10% | $14.27 | $16.10 | $18.54 |
Same company.
Same explicit five-year forecast.
Estimated value ranges from roughly $14 to $29 per share based on only two changed assumptions.
20. A valuation range is often more honest than a point estimate
Instead of saying:
“XYZ is worth exactly $19.26.”
a disciplined analyst might say:
“Under reasonable assumptions, estimated value appears to fall within a range, with $19.26 representing one central scenario.”
This acknowledges what the model actually knows.
Which is less than Excel’s formatting options imply.
21. Scenario analysis goes beyond changing two cells
You can also build complete scenarios.
Bear case
- slower revenue growth;
- lower margins;
- higher reinvestment;
- higher discount rate.
Base case
- reasonable operating assumptions;
- gradual normalization;
- mid-range discount rate.
Bull case
- stronger growth;
- better margins;
- more efficient reinvestment;
- possibly lower perceived risk.
Scenario analysis forces the valuation to tell a coherent business story.
22. The circular DCF mistake
A dangerous modeling habit works like this:
- You already want the stock to be worth $30.
- Your first DCF says $18.
- You increase growth.
- You lower the discount rate.
- You raise terminal margins.
- The model says $30.
- You congratulate the model for independently agreeing with you.
This is not valuation.
It is spreadsheet hostage negotiation.
23. False precision
Suppose your DCF inputs include:
- five years of revenue forecasts;
- future margins;
- future reinvestment;
- future taxes;
- a WACC estimate;
- a perpetual growth rate.
Every one contains uncertainty.
Reporting the final answer to four decimal places does not reduce that uncertainty.
It simply increases the number of decimal places participating in it.
24. Garbage in, discounted garbage out
A DCF cannot rescue unrealistic assumptions.
If a company:
- has never generated positive free cash flow;
- operates in a rapidly changing industry;
- has highly unpredictable margins;
- depends on uncertain regulatory approval;
the valuation range may be extremely wide.
The correct conclusion may be:
“The business is difficult to value with useful precision.”
That is a valid analytical outcome.
25. DCF is especially sensitive to long-duration assumptions
Companies whose expected value depends heavily on cash flows far into the future are especially sensitive to:
- discount rates;
- long-term growth;
- eventual margins;
- capital intensity.
This is the same principle that made high-growth equities rate-sensitive in VAL-05.
DCF simply makes the mathematics visible.
26. DCF and valuation multiples should talk to each other
DCF and multiples are not competing religions.
Use them as cross-checks.
If your DCF implies:
- a value of $30 per share;
- an implied 70× normalized earnings multiple;
- while every comparable company trades around 15×;
maybe XYZ truly deserves a spectacular premium.
Or maybe one of your assumptions has wandered off.
Relative valuation can help interrogate intrinsic valuation.
Intrinsic valuation can help challenge relative valuation.
27. Reverse DCF: ask what the market price assumes
A powerful alternative is to start with the current stock price and work backward.
Ask:
“What growth and margins would justify today’s market value?”
You can then judge whether those implied expectations seem:
- conservative;
- reasonable;
- heroic;
- or written by the company’s most enthusiastic intern.
Reverse DCF turns valuation from:
“What is my target price?”
into:
“What future is the market already paying for?”
28. Margin of safety belongs here too
DCF produces an estimate.
If your central estimate is $20 and the stock trades at $19.80, you do not have a meaningful margin for:
- forecast error;
- competitive surprises;
- economic downturn;
- execution mistakes;
- higher rates;
- plain bad luck.
The larger the uncertainty, the more valuable a margin of safety can become.
29. A practical Foundation DCF checklist
- Understand the business first.
- Choose FCFF or FCFE and stay internally consistent.
- Forecast business drivers, not arbitrary percentages.
- Use a discount rate appropriate to the cash flow and risk.
- Make long-term growth economically sustainable.
- Discount both explicit cash flow and terminal value.
- Bridge enterprise value to equity correctly.
- Use a realistic diluted share count.
- Run sensitivities and scenarios.
- Cross-check against multiples and business reality.
30. Why this matters for StockScreen.art
StockScreen.art is designed to help identify and analyze market opportunities using price, momentum, trend, relative strength, volatility and risk/reward.
DCF asks a different question:
“What would the underlying business be worth if my assumptions about its future cash generation are reasonable?”
These approaches can complement each other.
A stock can have:
- strong momentum and attractive valuation;
- strong momentum but heroic implied expectations;
- weak momentum but an apparently large margin of safety;
- excellent fundamentals with no favorable market confirmation yet.
Stock screening tells you where the market evidence is.
Valuation helps tell you what expectations may already be embedded in the price.
31. Nine mental models worth keeping
- DCF = present value of expected future cash flows.
- Future money is discounted because time and risk matter.
- Match the cash flow with the correct discount rate.
- Forecast the business, not the spreadsheet.
- Terminal value is powerful enough to dominate the model.
- Enterprise value and equity value are different.
- Sensitivity analysis is part of the valuation, not an appendix.
- A precise number can still come from uncertain assumptions.
- DCF is a framework for disciplined thinking, not a machine for predicting prices.
Quick knowledge check
Ten questions. Calculators may participate. Crystal balls may not.
1. What is the core idea behind DCF valuation?
The value of an asset can be estimated as the present value of its expected future cash flows.
2. Why is $100 five years from now worth less than $100 today?
Because money available today has alternative uses and future receipt involves time and risk. Discounting converts future cash to a present-value equivalent.
3. In a standard FCFF DCF, what discount rate is commonly used?
Weighted Average Cost of Capital, or WACC.
4. What value does an FCFF/WACC DCF estimate before financing adjustments?
Enterprise value.
5. What does terminal value represent?
The estimated value of cash flows occurring after the explicit forecast period.
6. In a stable-growth terminal-value formula, can perpetual growth equal or exceed the discount rate?
No. The stable-growth model requires the discount rate to exceed the perpetual growth rate, and the long-term growth assumption must also be economically sustainable.
7. Why can terminal value be dangerous?
Because it can represent most of the calculated DCF value, so small changes in long-term assumptions can materially change the result.
8. What is a simplified bridge from enterprise value to common-equity value?
Enterprise value minus debt plus cash, while recognizing that professional models may require additional adjustments.
9. Why should DCF sensitivity analysis be performed?
To show how the valuation changes when uncertain assumptions such as discount rate, growth or margins change.
10. What is a reverse DCF?
A framework that starts from the current market price and asks what future growth, margins or cash flows would be required to justify that price.
Module complete: where we go next
You have now completed the six lessons in Understanding Companies & Valuation.
We moved from:
- revenue, earnings and cash flow;
- income statements and balance sheets;
- free cash flow;
- valuation multiples;
- growth versus value;
- to discounted cash flow valuation.
The next Foundation module is:
Stock Analysis & Screening.
The first two curriculum items already connect to StockScreen.art’s existing technical-indicator and momentum-screening research.
The next new Foundation lesson to build is:
FND-SA-03 — How Stock Screening Works.
This is where several thousand securities meet a collection of filters and discover that only twelve of them were invited to the research list.
Primary sources & further reading
- NYU Stern / Aswath Damodaran — Discounted Cash Flow Valuation Fundamentals
- NYU Stern / Aswath Damodaran — FCFF Valuation Models
- NYU Stern / Aswath Damodaran — Estimating Terminal Value
- Investor.gov — Present Value Explanation
- Investor.gov — How to Read a 10-K/10-Q