AlphaEngine Scan Summary
Why Technical Indicators Matter
Investors are surrounded by information. Earnings reports, analyst opinions, economic data, news headlines and social media can all influence stock prices. Technical analysis helps cut through that noise by focusing on what the market is actually doing.
Technical indicators allow investors to identify trends, evaluate momentum, measure risk and determine whether a stock may be entering a favorable or unfavorable phase. No indicator can predict the future, but indicators can help investors create a more structured research process.
Investors can apply these concepts using the StockScreen.art Stock Analysis Tool or by starting with the free StockScreen.art stock screener.
1. Identifying the Trend with Moving Averages
Moving averages help investors determine whether a stock is in an uptrend, downtrend or sideways market. The most common moving averages are the 20-day, 50-day and 200-day moving averages.
A stock trading above its 200-day moving average is generally considered to be in a stronger long-term technical position than a stock trading below it. When shorter-term moving averages are also above longer-term moving averages, the trend structure may be even stronger.
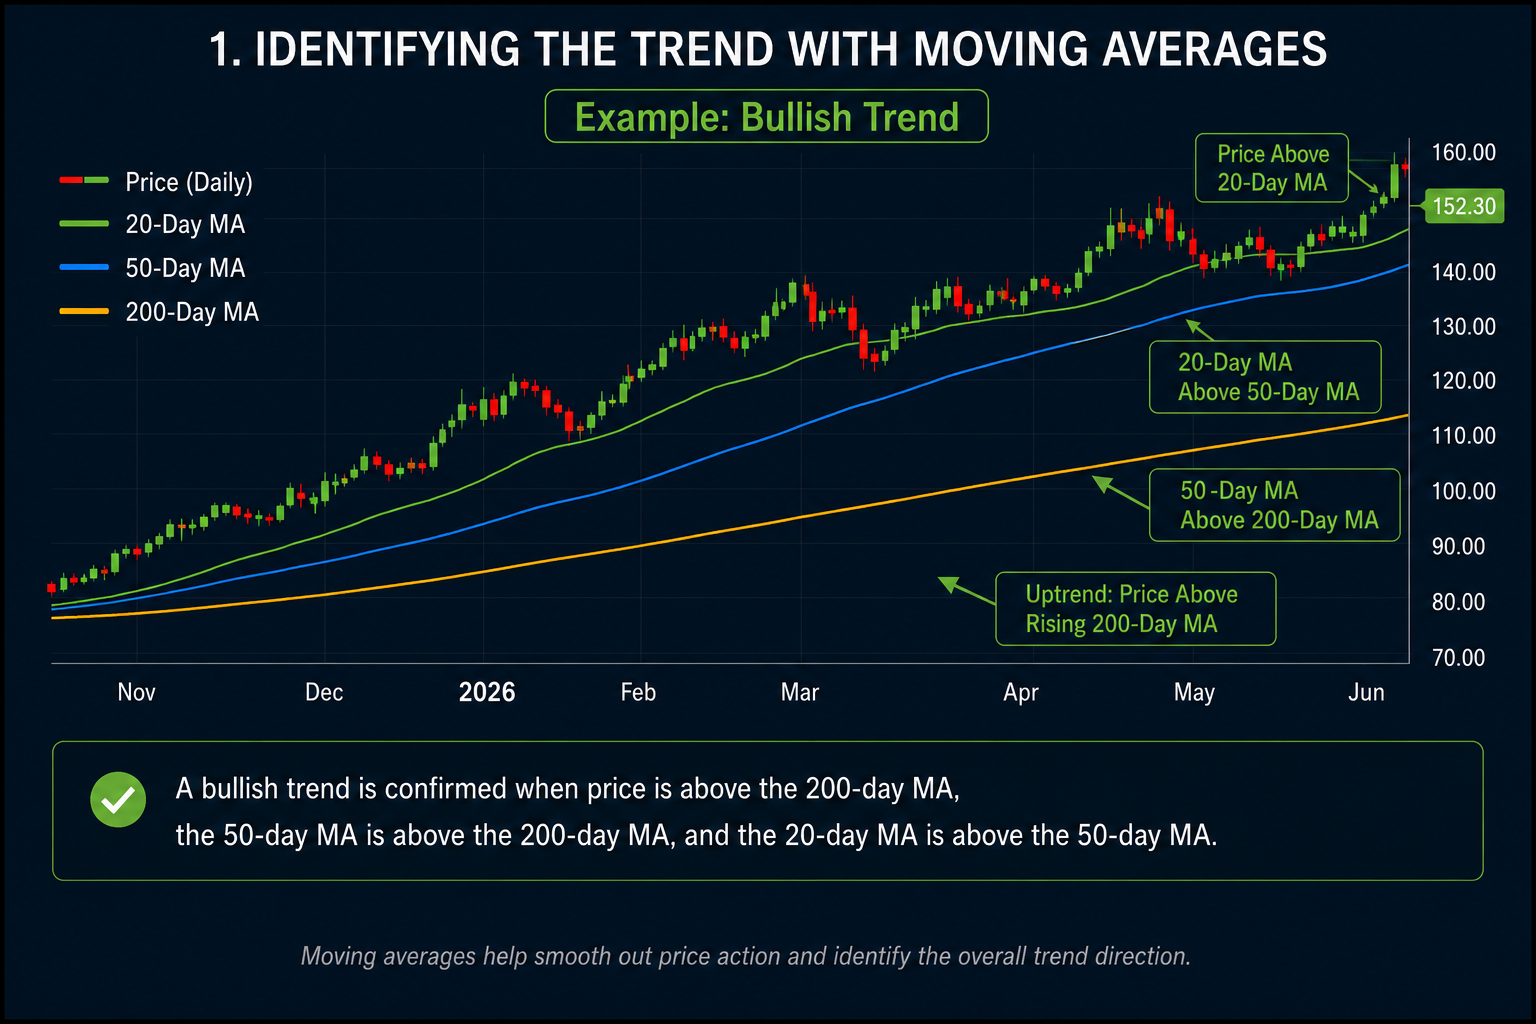
Figure 1: A bullish trend is often confirmed when price remains above the 200-day moving average, the 50-day moving average remains above the 200-day moving average, and the 20-day moving average remains above the 50-day moving average.
What investors often look for
- Price above the 200-day moving average
- A rising 200-day moving average
- 20-day moving average above the 50-day moving average
- 50-day moving average above the 200-day moving average
2. Measuring Momentum with RSI
The Relative Strength Index, or RSI, measures momentum on a scale from 0 to 100. It helps investors evaluate whether a stock may be gaining strength, losing strength or becoming overextended.
Common RSI interpretation:
- RSI below 30 may indicate oversold conditions
- RSI between 30 and 70 is often considered neutral
- RSI above 70 may indicate overbought conditions
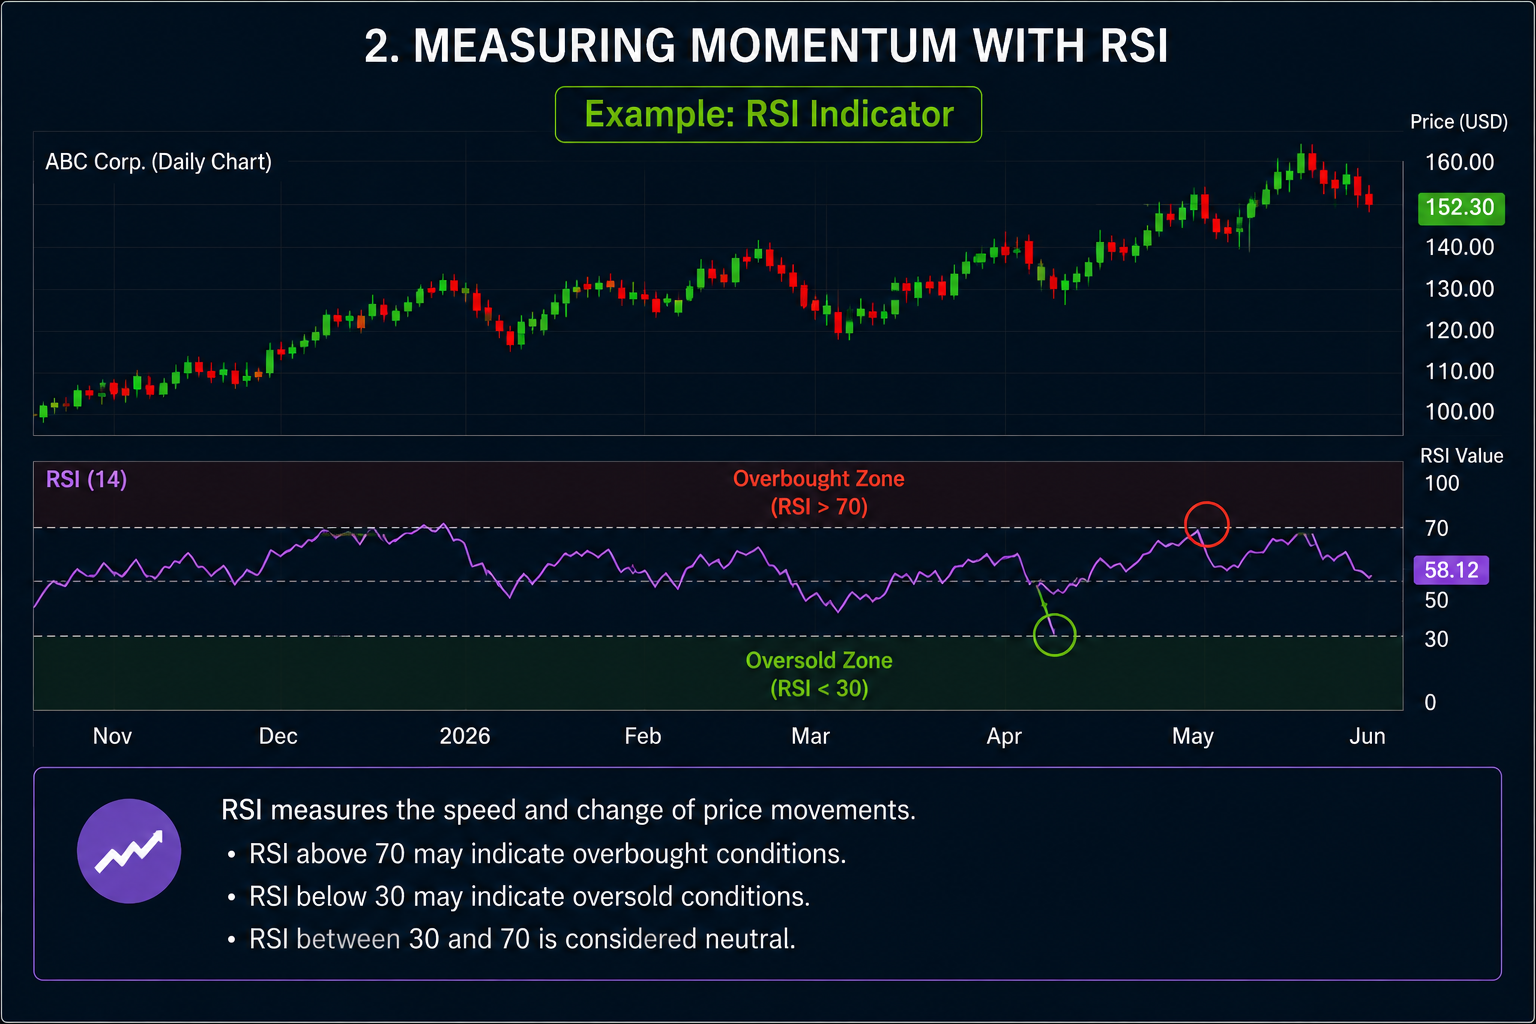
Figure 2: RSI helps investors identify periods where price momentum may be stretched. Readings above 70 can indicate strong buying pressure, while readings below 30 may indicate excessive selling pressure.
RSI should not be used by itself. Strong stocks can remain elevated for extended periods, and weak stocks can stay weak longer than expected. RSI is most useful when combined with trend, momentum and risk analysis.
3. Using MACD to Spot Momentum Shifts
The Moving Average Convergence Divergence indicator, commonly called MACD, helps investors evaluate changes in momentum. MACD is often used to identify whether momentum is improving or weakening.
A bullish MACD crossover occurs when the MACD line crosses above the signal line. This can suggest that momentum is improving, especially when it occurs while the stock is already in a positive trend.
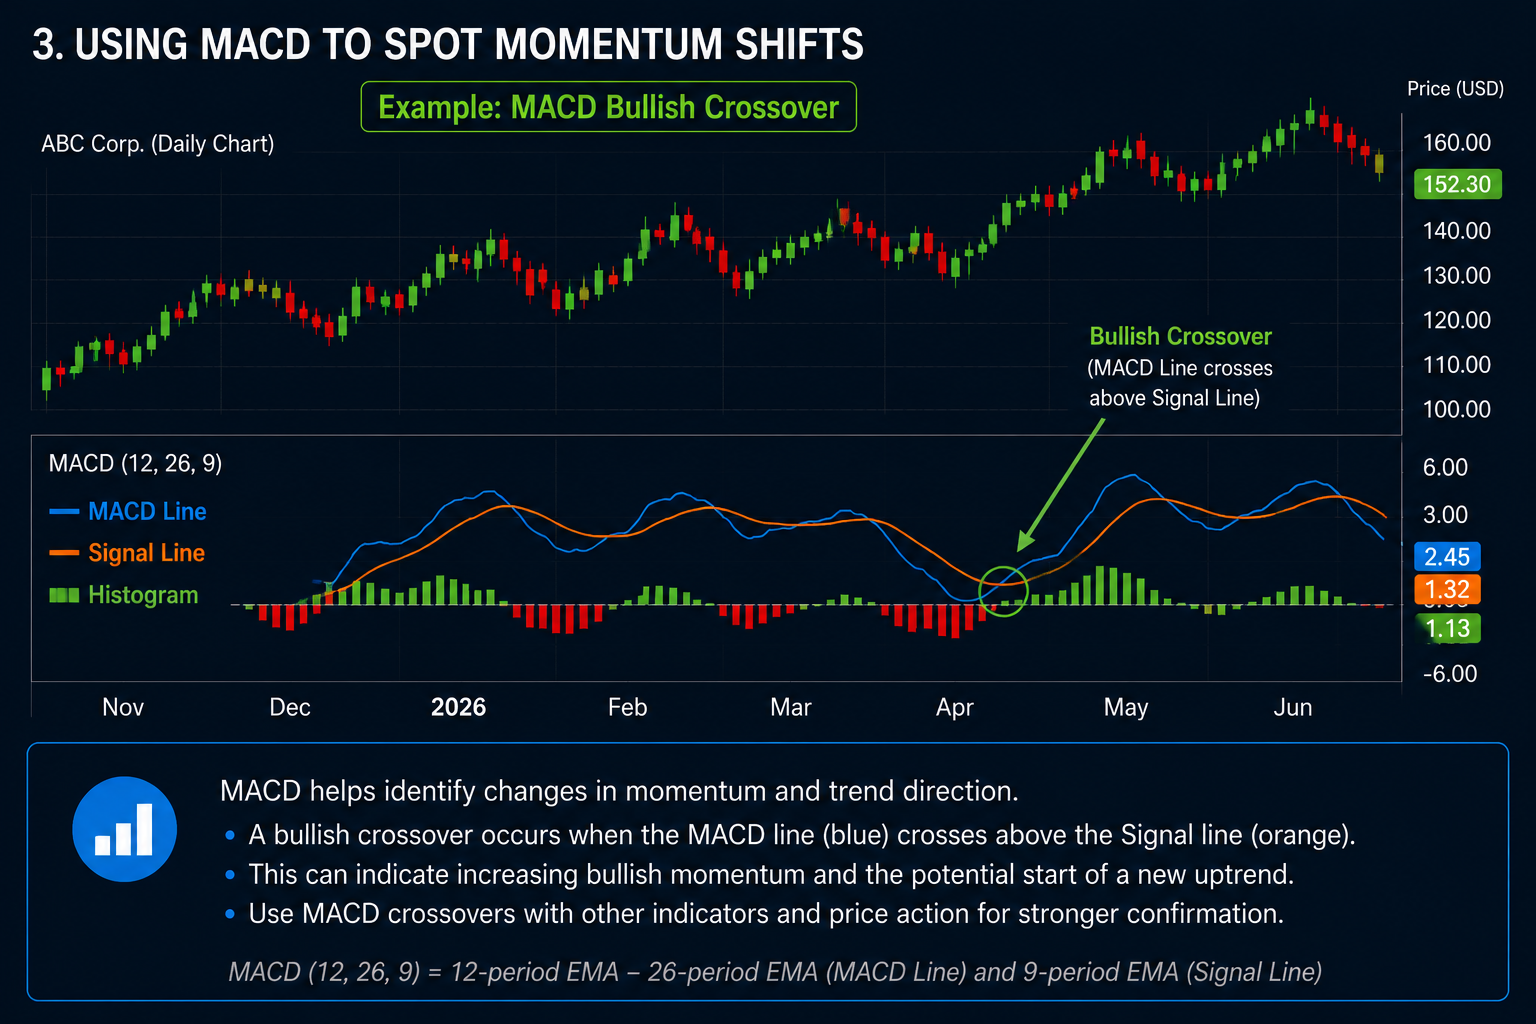
Figure 3: A bullish MACD crossover can indicate strengthening momentum and may signal the beginning of a new trend. MACD is often used as confirmation rather than as a standalone signal.
What makes MACD useful
- It helps identify momentum shifts
- It can confirm trend changes
- It works well alongside moving averages and RSI
4. Confirming Breakouts with Volume
Volume measures participation in the market. A breakout supported by strong volume is generally considered more meaningful than a breakout occurring on weak volume.
When a stock moves above resistance with significantly higher trading volume, it may indicate that more investors are participating in the move. Low-volume breakouts can be more vulnerable to reversal.

Figure 4: Breakouts accompanied by increased trading volume often have a higher probability of success than breakouts occurring on low volume.
Why volume matters
- Higher volume suggests stronger investor participation
- Volume can confirm price strength
- Weak volume can signal a possible false breakout
5. Combining Indicators
One of the biggest mistakes investors make is relying on a single indicator. RSI alone is not enough. MACD alone is not enough. A moving average crossover alone is not enough.
A stronger technical setup may include:
- Price above the 200-day moving average
- RSI in a healthy momentum range
- Bullish MACD confirmation
- Positive relative strength
- Increasing volume during upward price movement
- Clear entry, target and stop-loss levels
The more independent indicators that support the same conclusion, the stronger the technical case may become.
6. Risk Management Still Matters
Technical indicators can help identify potential opportunities, but risk management determines whether an idea is practical. Investors should understand the possible downside before focusing on upside.
Common risk tools include:
- Entry level: the price area where the setup is being evaluated.
- Target price: a possible upside level based on the current setup.
- Stop-loss level: a downside level used to manage risk if the setup fails.
- Risk/reward ratio: the relationship between potential upside and potential downside.
How StockScreen.art Helps Investors Analyze Stocks
StockScreen.art combines multiple technical indicators into a structured research framework designed to help investors identify potential opportunities more efficiently. Instead of manually calculating every signal, users can enter a ticker and review trend signals, momentum indicators, recommendations, target prices and stop-loss levels in one place.
To research a stock, use the Stock Analysis Tool. To discover potential stock ideas, start with the free stock screener. For weekly high-conviction research, explore AlphaEngine™.
Final Thoughts
Technical indicators are not crystal balls. No indicator can predict future market performance with certainty. However, technical analysis can provide a structured framework for evaluating stocks and identifying opportunities that deserve further research.
By combining trend analysis, momentum indicators, volume confirmation and disciplined risk management, investors can make more informed decisions and avoid relying solely on emotion or headlines.
Disclaimer: StockScreen.art provides educational research tools only and does not provide financial advice. Always conduct your own due diligence before making investment decisions.