AlphaEngine Scan Summary
Use the course navigation below to continue through the curriculum or jump to closely related lessons.
How to Screen Stocks for Momentum: Start by Saying “No”
A stock screener sounds wonderfully sophisticated. Feed in a few criteria, press a button, and somewhere deep inside the machine a tiny Wall Street wizard supposedly hands you a list of future winners.
Sadly, the tiny wizard has the day off.
A good momentum screen does something less magical and much more useful: it removes large numbers of stocks that are not worth your attention right now. That is the real job. You are not asking a screener to predict the future. You are asking it to help you shrink a noisy market into a manageable research list. The Foundation lesson on how stock screening works explains the broader filtering-and-ranking process behind that idea.
A practical way to screen stocks for momentum is to work in stages: first remove illiquid securities, then require a constructive trend, compare relative strength, confirm participation with volume, check volatility and finally evaluate whether the remaining setup offers a sensible entry and risk/reward profile. The purpose is not to find the stock that moved the most yesterday. It is to find persistent, tradable strength that survives several independent checks.
Think of the process as organized rejection. Too illiquid? No. Long-term downtrend? No. Weak relative strength? No. One heroic green candle after three months of misery? Very exciting, but also no. By the time the screen is finished, the goal is to have a small group of stocks where trend, momentum, participation and risk look reasonably compatible.
You can apply this process manually, or use the free U.S. stock screener to narrow the field before moving to deeper MarketEngine™ stock analysis. For a broader explanation of how AI-assisted stock research works beyond the screening stage, see our AI stock analysis guide.
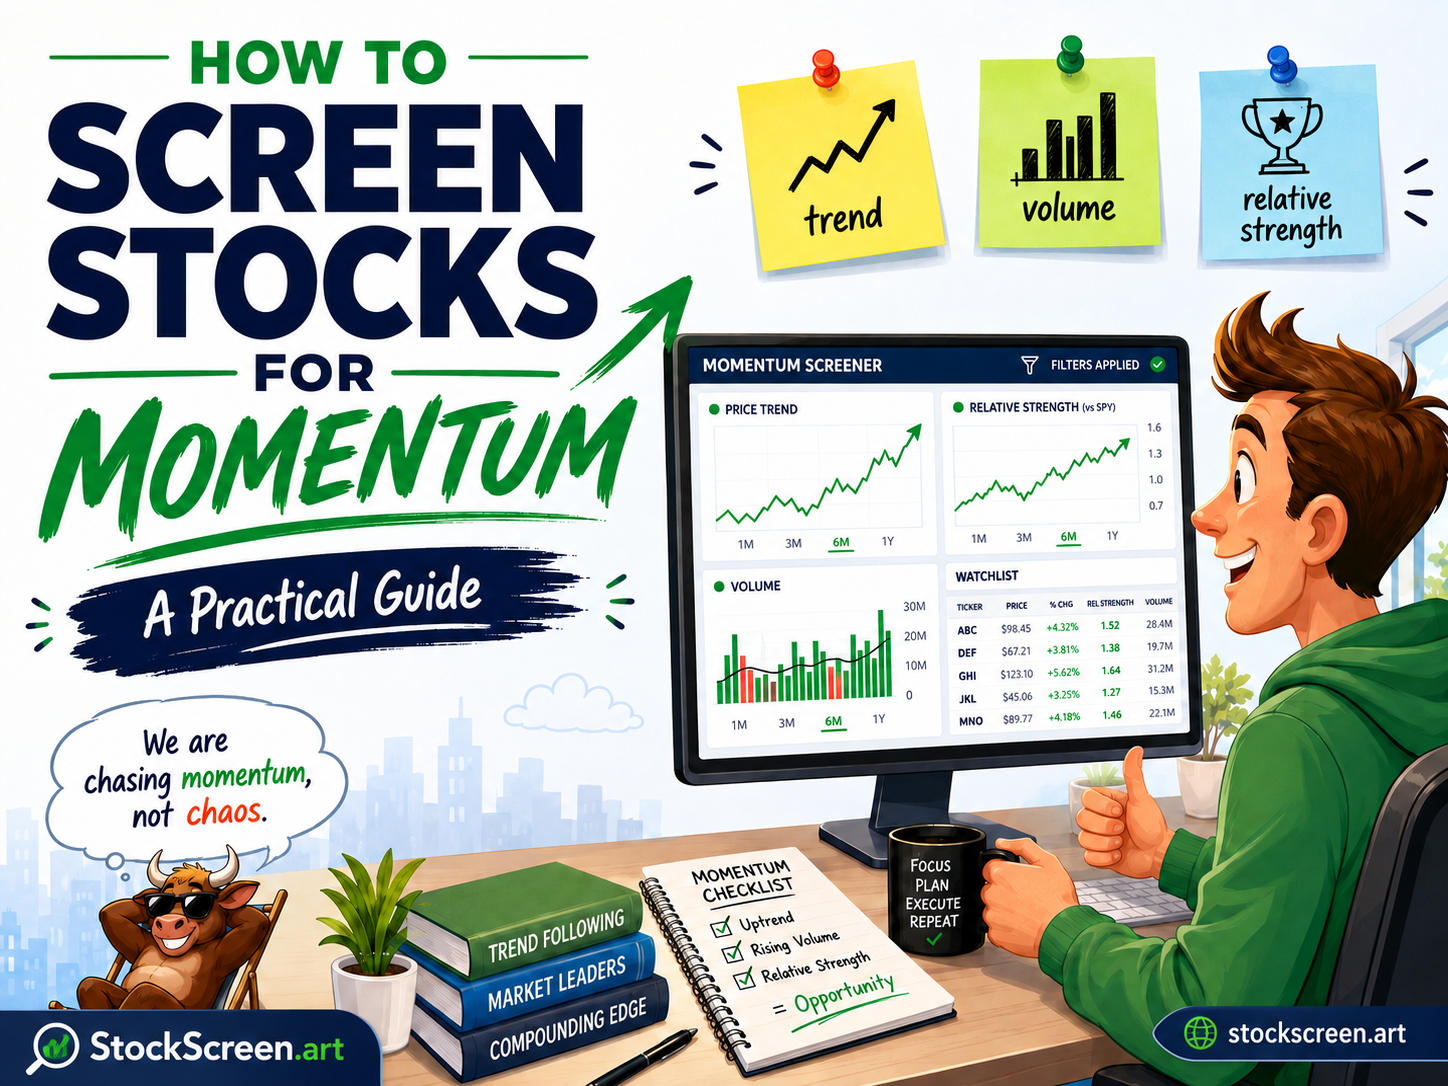
Figure 1: Momentum screening is not about chasing every stock with a green chart. The useful part is combining trend, volume, relative strength and risk into one repeatable process. The coffee is optional. The process is not.
What Does “Momentum” Actually Mean?
In plain English, momentum means that a stock has been moving with enough persistence that the move may deserve further attention. The important word is persistence. A stock that jumps 18% because somebody on television said “game changer” has movement. It does not automatically have durable momentum.
Healthy momentum usually has several supporting characteristics. Price is trending in a constructive direction. The stock is holding up well compared with the broader market. Trading volume is healthy enough to suggest real participation. The move is not so wildly extended that buying it feels like trying to board a train after it has already left the station, crossed two provinces and entered another time zone.
Momentum screening therefore works best when it asks several different questions instead of worshipping one indicator. If you want a deeper explanation of the individual tools, see Best Technical Indicators for Stocks: How to Analyze Stocks.
Step 1: Start With Stocks You Can Actually Trade
Liquidity is not glamorous, which is probably why it is so easy to ignore. Nobody posts a dramatic screenshot saying, “Look at this magnificent average daily volume.” They probably should.
A momentum screen should generally begin by removing stocks with extremely low trading volume or very limited dollar volume. Thinly traded stocks can produce dramatic price moves because a relatively small number of orders can push the price around. That makes the chart look exciting while making entries, exits and stop-loss execution considerably less charming.
Useful liquidity filters can include:
- A reasonable minimum share price
- A minimum average daily trading volume
- A minimum average daily dollar volume
- Exclusion of instruments that do not fit your strategy, such as warrants, thinly traded microcaps or other specialized securities
The exact thresholds depend on the investor and the strategy. The principle is more important than the number: before asking whether a stock has momentum, make sure it has a functioning market.
Step 2: Make the Trend Prove Itself
Momentum is easier to work with when the larger trend is already helping rather than fighting you. A stock can bounce sharply inside a long-term downtrend, but that is a very different setup from a stock making steady progress above rising moving averages.
A simple trend screen might look for combinations such as:
- Price above the 50-day moving average
- Price above the 200-day moving average
- The 50-day moving average above the 200-day moving average
- A rising 200-day moving average
- The 20-day moving average holding above or near the 50-day moving average
None of these conditions is sacred. Markets do not receive a memo reminding them to respect your moving averages. The point is to create a consistent definition of an established trend so that every attractive-looking chart is judged by the same rules.
Step 3: Compare the Stock With the Market
A stock rising 5% can look impressive until you discover that its sector rose 12% and the broader market rose 8%. Congratulations: you found the slowest horse in a very fast race.
Relative strength helps solve that problem. Instead of asking only whether the stock has gone up, you ask whether it has performed better than a benchmark, its sector or a relevant group of peers. For a deeper explanation, see the Understanding Relative Strength lesson.
For momentum screening, relative strength is valuable because leadership tends to matter. If two stocks have similar trend structures, the one consistently outperforming the market may deserve more attention than the one merely being carried upward by a strong market tide.
Useful comparison windows can include one month, three months and six months. Looking across several periods helps distinguish persistent leadership from one lucky week involving an earnings surprise and a suspicious amount of confetti.
Step 4: Ask Volume Whether It Believes the Story
Price tells you what happened. Volume helps tell you how many people showed up for it.
A breakout accompanied by expanding volume can suggest stronger participation. A breakout on sleepy volume is less convincing. It may still work, but it deserves more skepticism. If price is yelling “historic breakout!” while volume is lying on the couch in pajamas, the two are not exactly presenting a united front. The Volume, Breakouts and Confirmation lesson goes deeper into that relationship.
Momentum screens can look for:
- Volume expanding on strong up days
- Recent volume above the stock's longer-term average
- Healthy liquidity during breakouts
- No obvious pattern of dramatic price spikes occurring on tiny volume
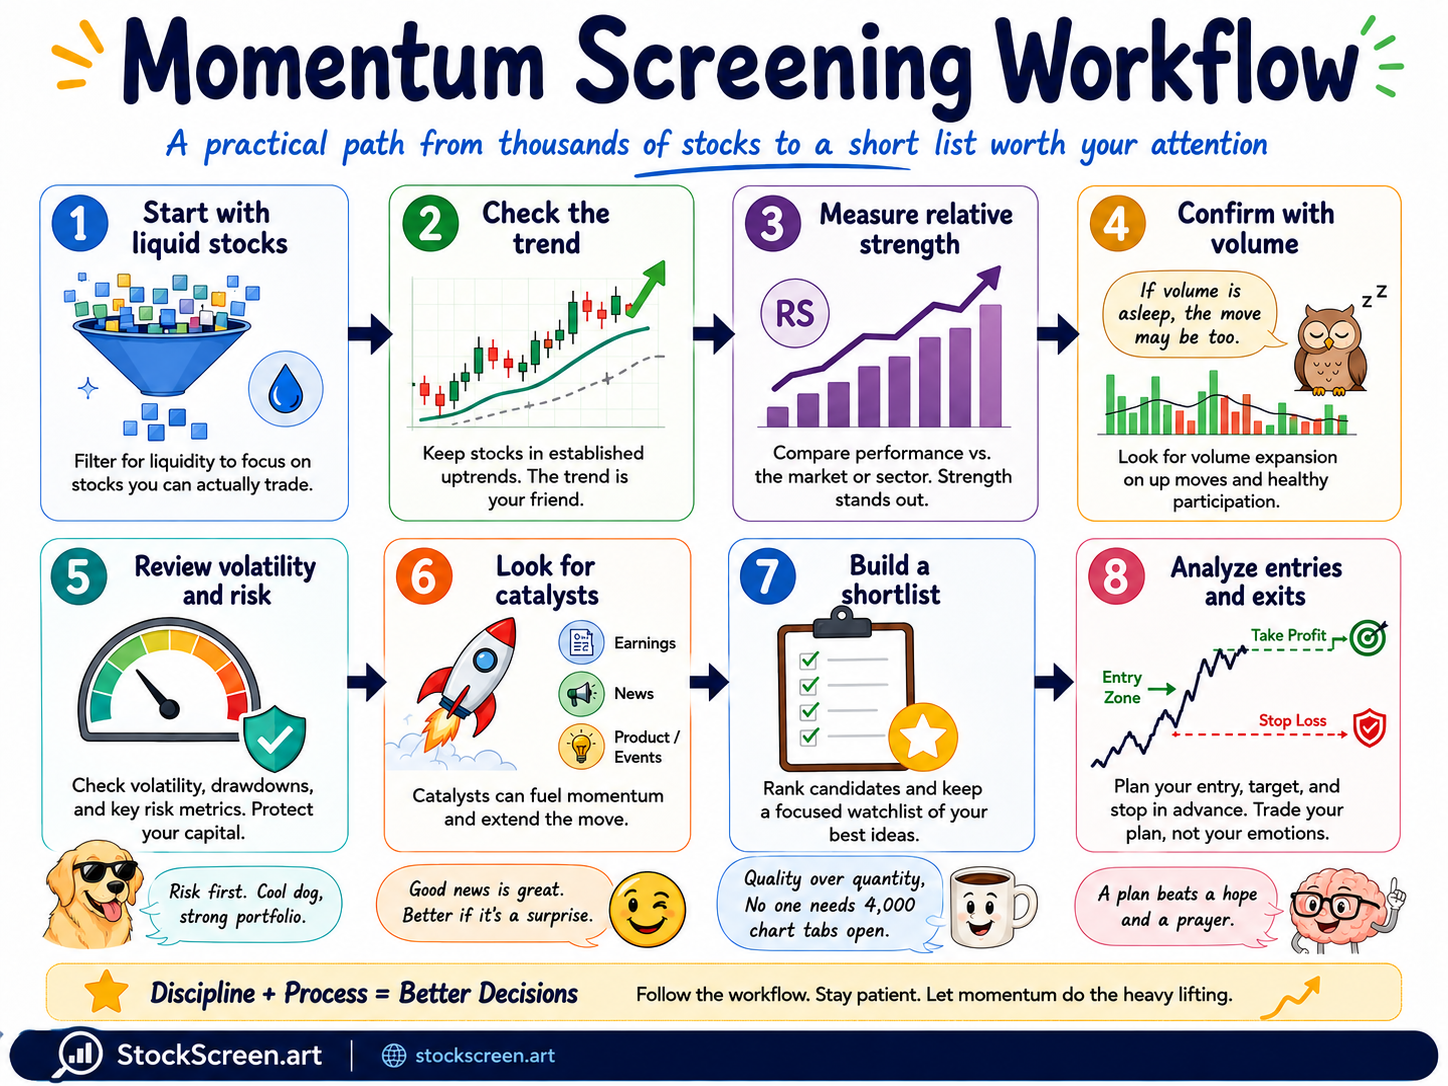
Figure 2: A practical momentum workflow. The order matters: start broad, eliminate weak candidates, then spend your research time on the much smaller group that survives. Four thousand open chart tabs are not a research strategy. They are a cry for help.
Step 5: Check Volatility Before You Fall in Love
Strong momentum and high volatility often travel together. Sometimes they are best friends. Sometimes volatility is the friend who says, “Trust me, this will be fun,” five minutes before everyone is explaining the situation to security.
A stock can have excellent trend and momentum characteristics while still being unsuitable because its normal daily price movement is too large. Average True Range, or ATR, is one way to measure that volatility.
Rather than looking only at ATR in dollars, investors can compare ATR with the stock price. A $4 daily range means something very different for a $20 stock than for a $400 stock.
The question is not “Is volatility bad?” The better question is “Can I define a sensible risk level for this stock without placing the stop so close that normal market noise knocks me out, or so far away that the downside becomes ridiculous?”
Step 6: Look for Context and Catalysts
Technical momentum can exist without a fresh news catalyst, but understanding why a stock may be attracting attention is still useful. Earnings surprises, guidance changes, product announcements, industry developments and major corporate events can all influence how durable a move becomes.
The danger is reversing the process: starting with a dramatic headline and then desperately searching the chart for evidence that agrees with it. That is not analysis. That is confirmation bias wearing a tie.
Use catalysts as context, not permission. A wonderful story does not repair a broken chart, poor liquidity or an absurd risk profile.
Step 7: Build a Shortlist, Not a Stock Zoo
Once the screen has done its job, resist the urge to keep every surviving stock. A watchlist with 137 “high-priority” names has misunderstood the meaning of both “high” and “priority.”
Rank the candidates using the factors that matter to your process. For example:
- Trend quality
- Momentum persistence
- Relative strength
- Volume confirmation
- Liquidity
- Volatility
- Distance from a reasonable entry area
- Potential reward compared with the downside risk
The goal is not to produce a giant list of stocks that technically qualify. The goal is to identify the handful that deserve a closer look.
Step 8: Turn the Screen Into an Actual Research Plan
A screener finds candidates. It does not tell you that you must buy them.
Once a stock reaches the shortlist, switch from screening mode to analysis mode. Review the chart in more detail, examine current price behavior, look at the relevant technical indicators and define what would make the idea attractive or unattractive.
At minimum, think about three levels:
- Entry area: where the setup becomes interesting rather than merely exciting.
- Target area: where the potential upside begins to justify the trade or research thesis.
- Stop or invalidation level: where the original setup has weakened enough that continuing to defend it becomes an emotional hobby.
These levels belong to the risk plan rather than the screening score itself. The Foundation lesson on risk/reward and position planning explains how entry, target and invalidation levels fit together before capital is put at risk.
This is where MarketEngine™ stock analysis becomes useful after screening: the broad market filter finds candidates, and the individual analysis page helps evaluate the surviving ticker in more detail. Readers who want the broader methodology behind AI-assisted stock research can also review the AI stock analysis guide.
A Simple Momentum Screen in Practice
Imagine starting with several thousand U.S. stocks. Your first pass removes securities that are too cheap, too thinly traded or outside the universe you actually want to research. The second pass keeps stocks with constructive long-term trends. The third favors stocks showing positive relative strength over multiple periods. Then volume and volatility filters remove candidates where the move looks fragile or the risk is difficult to control.
Perhaps 2,000 names become 600. Six hundred become 150. One hundred fifty become 40. After ranking and a closer chart review, maybe eight or ten names remain.
That is the point of screening.
You did not predict which stock will go up tomorrow. You reduced the number of things demanding your attention from “the entire stock market” to “a list that can be reviewed before your coffee gets cold.”
Common Momentum Traps
Momentum investing has a special talent for producing charts that look irresistible exactly five minutes before they become educational. A few traps deserve permanent residence on the mental checklist.
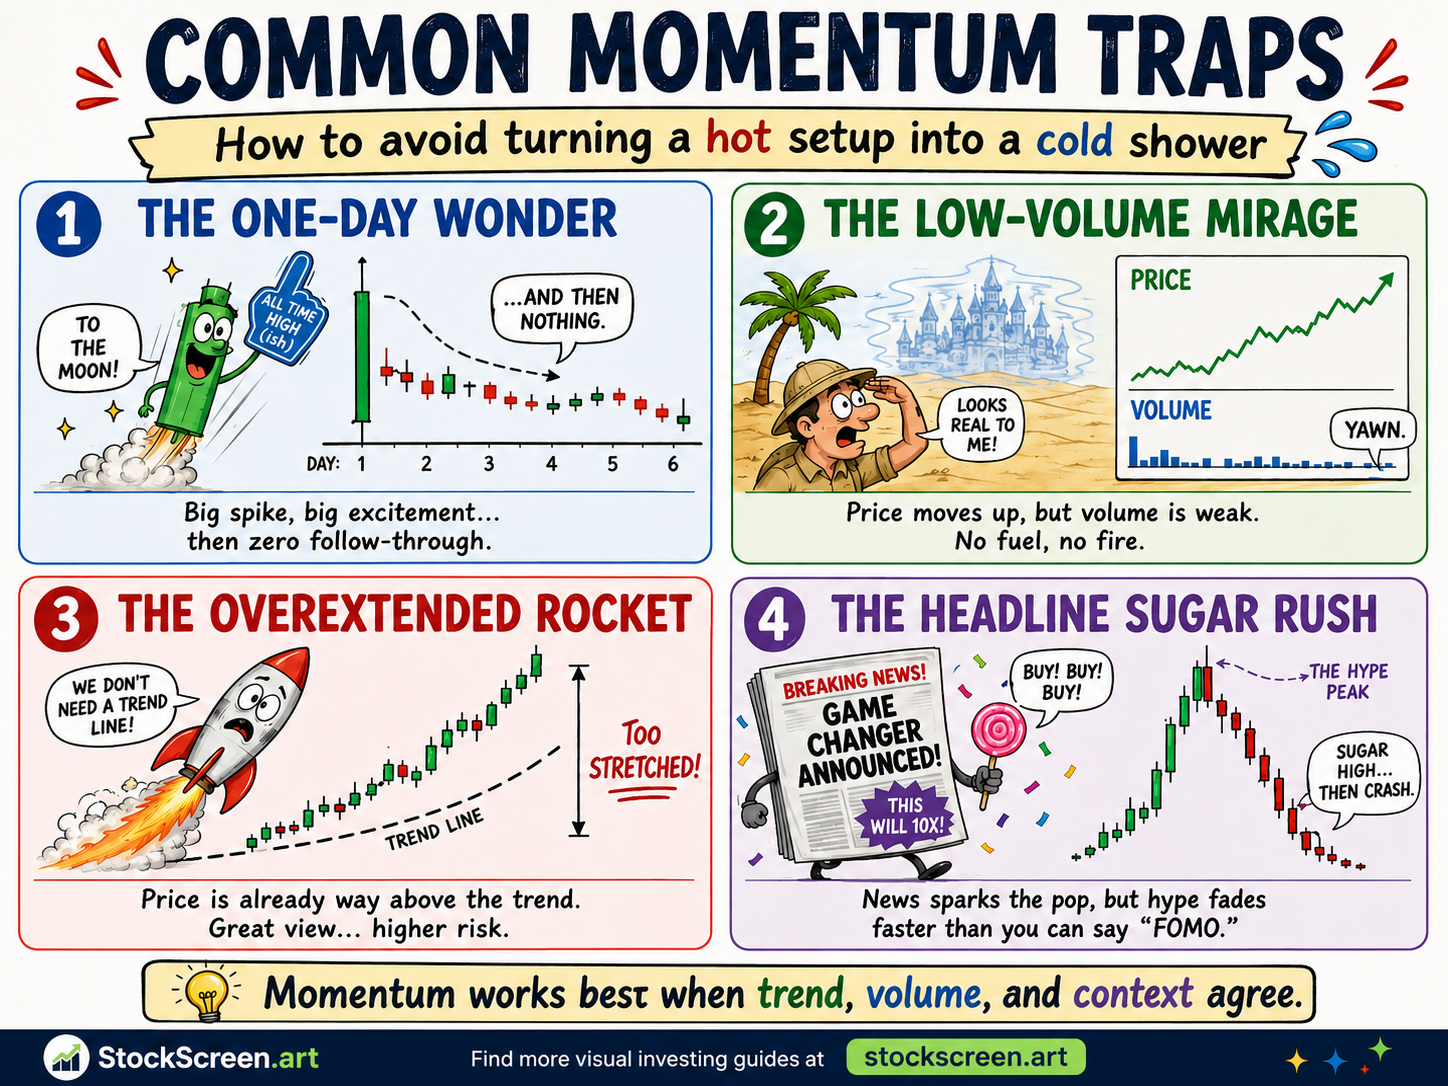
Figure 3: Four classics: the one-day wonder, the low-volume mirage, the overextended rocket and the headline sugar rush. Markets keep producing new technologies, new industries and new acronyms. Human behavior remains impressively committed to the original material.
The One-Day Wonder
One giant price spike does not create a trend. If there is no follow-through, the move may simply represent a temporary reaction to news, short covering or speculative enthusiasm.
The Low-Volume Mirage
A rising price on weak participation can look much better on the chart than it feels when you try to trade it. Stronger moves generally become more interesting when volume confirms that other market participants have also noticed.
The Overextended Rocket
A stock can be excellent and still be a terrible entry at a particular moment. When price has moved far above its normal trend or volatility range, the potential reward may shrink while the downside to a reasonable support level grows. “But it keeps going up” is an observation, not a risk-management framework.
The Headline Sugar Rush
News can produce immediate buying pressure, especially when the headline includes phrases such as “breakthrough,” “transformational,” or the always soothing “total addressable market.” The move may be legitimate. It may also fade when investors finish reading past the headline.
What a Good Momentum Screen Should Not Do
A useful screen should not pretend to know the future. It should not produce twenty-seven decimal places of fake certainty. It should not hide risk behind a large green “BUY” badge. And it should not encourage investors to confuse recent performance with guaranteed future performance.
A good screen should make the research process more disciplined. It should use consistent rules, explain why a stock qualified, and make it easier to compare candidates using the same framework.
How StockScreen.art Approaches Momentum Screening
StockScreen.art is designed around that filtering idea. The free U.S. stock screener helps surface stock opportunities for further research, while MarketEngine™ stock analysis provides a deeper view of an individual ticker. The broader concepts, strengths and limitations of AI-assisted stock research are explained separately in our AI stock analysis guide.
The broader StockScreen.art research process considers factors such as trend structure, momentum, relative strength, volume, expected upside and risk/reward rather than treating a single indicator as a verdict. AlphaEngine™ quantitative stock rankings apply a more structured process to narrow the universe into focused research candidates. For the research-engineering layer behind comparing qualified candidates, see our Labs guides to machine learning stock selection and machine learning stock ranking.
For examples of stocks that have recently shown growth and momentum characteristics, see Strong Growth and Momentum Stocks. Those examples are separate from this guide: this article explains the process, while the other page shows what candidates can look like in practice.
Momentum Stock Screening Questions
What is the best way to screen stocks for momentum?
Start with liquidity, then require a constructive trend, compare relative strength, check whether volume supports the move, evaluate volatility and finally review entry, target and downside risk. The strongest candidates usually survive several independent filters rather than qualifying because of one indicator.
Should momentum screens use RSI?
RSI can be useful as a momentum measure, but it should not be the entire screen. Strong stocks can remain at elevated RSI levels for extended periods, so trend, relative strength, volume and risk context matter as well.
Is a momentum stock screener the same as a buy signal?
No. A screener narrows a large market into a shortlist for further research. A stock that passes momentum filters still needs deeper analysis, a practical entry area and an acceptable risk/reward profile before it becomes a serious investment candidate.
A Momentum Screening Checklist
Before a stock reaches your serious-research list, ask:
- Is the stock sufficiently liquid?
- Is the longer-term trend constructive?
- Is momentum persistent rather than based on one dramatic day?
- Is the stock outperforming the broader market or relevant peers?
- Does volume support the recent move?
- Is volatility manageable?
- Is the stock already badly overextended?
- Can you define a reasonable entry, target and downside level?
- Does the setup still make sense after the excitement is removed?
That final question is particularly useful. Markets are very good at making ordinary situations feel urgent. A checklist is cheaper than therapy and usually faster.
Final Thoughts
Momentum screening is not about finding whatever stock went up the most yesterday. It is about finding stocks where several independent pieces of evidence suggest that strength may be more than random noise.
Start with liquidity. Confirm the trend. Compare relative strength. Check volume. Respect volatility. Understand the context. Then create a shortlist small enough that you can actually research the companies on it.
The screen does not make the decision for you. It gives you a better place to start.
And in a market containing thousands of securities, endless headlines, social-media hot takes and at least one person every day announcing that a stock is “literally going to the moon,” a better place to start is already a meaningful advantage.
Disclaimer: StockScreen.art provides educational stock research tools and information only. Nothing in this article constitutes financial or investment advice. Markets involve risk, and no screening method can guarantee future performance.
Copyright: © 2026 StockScreen.art. All rights reserved. Reproduction, republication, redistribution or reuse of this article or its graphics is not permitted without prior written permission from StockScreen.art.