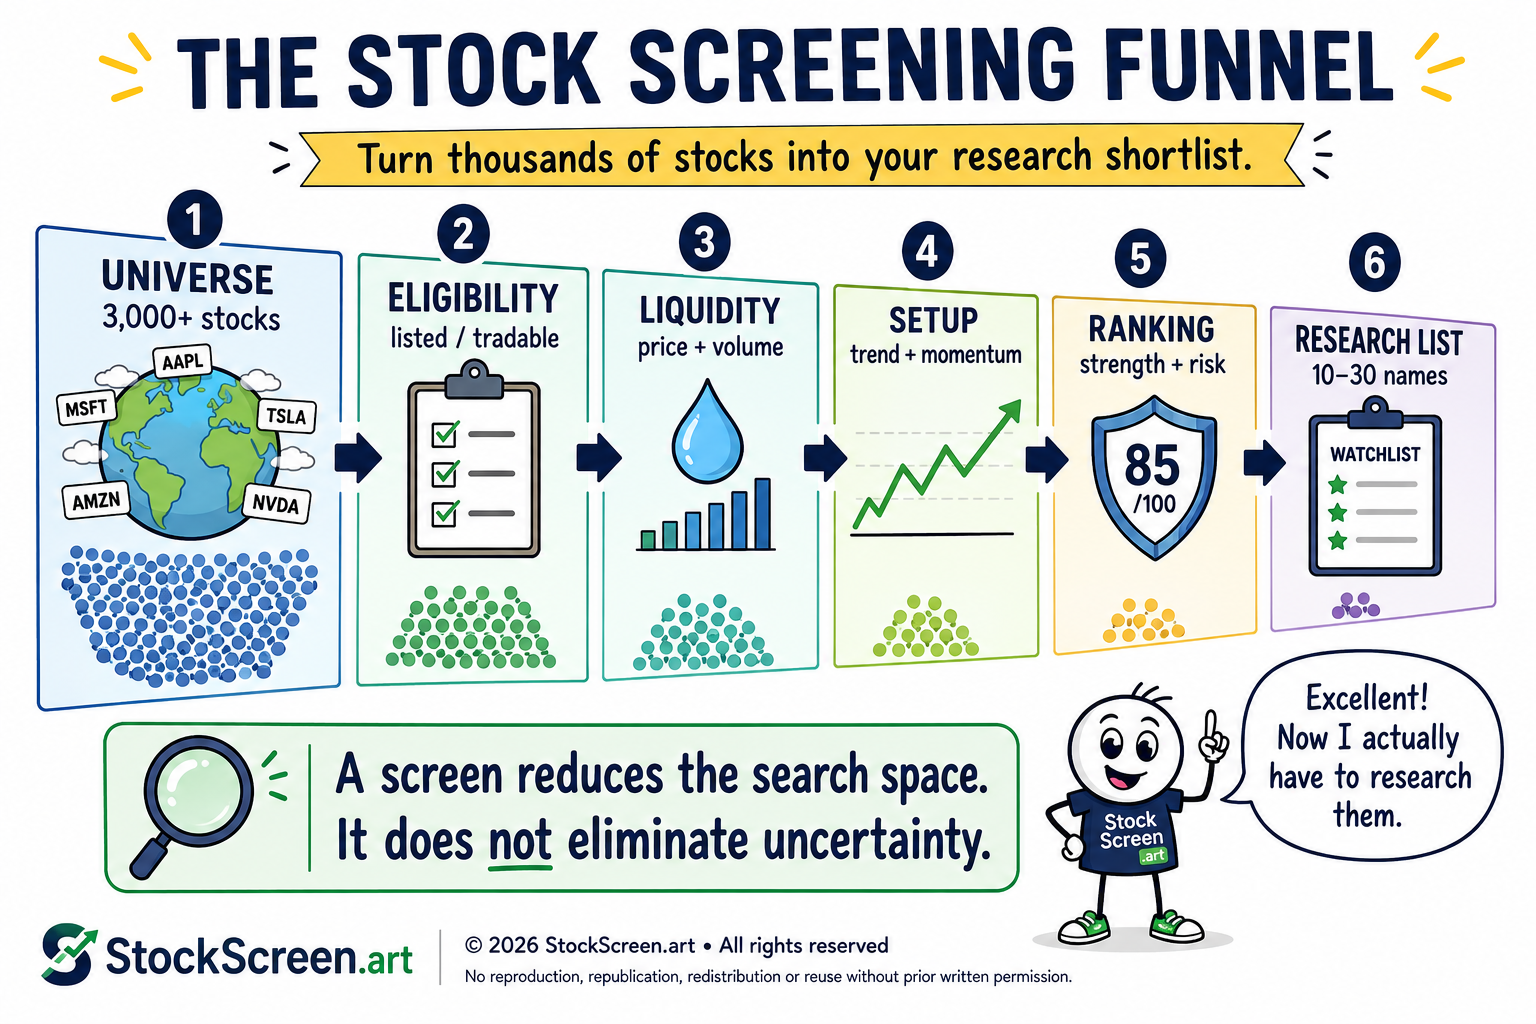
Imagine you have 3,000 stocks in front of you.
Somewhere inside that pile may be:
- strong businesses;
- weak businesses;
- fast-growing businesses;
- cheap businesses;
- stocks with excellent momentum;
- stocks with excellent momentum directly toward a cliff.
You could research every one individually.
You could also cancel everything else scheduled for the next seven years.
A stock screener exists to solve that search problem.
That sounds simple.
The interesting part is deciding:
What belongs in the universe?
Which rules matter?
Which rules should eliminate a stock?
Which rules should merely improve its rank?
And what do you do after the screen finishes?
1. Screening is search, not prediction
This distinction is the foundation of the lesson.
A screener can answer:
- Which stocks trade above their 200-day moving average?
- Which companies grew revenue more than 15%?
- Which securities trade at least $20 million in average dollar volume?
- Which stocks have positive relative strength versus a benchmark?
- Which profitable companies trade below a chosen valuation multiple?
A screener cannot answer with certainty:
“Which of these stocks will rise next week?”
That question contains a future the database does not have.
2. Step zero: define the purpose
A good screen begins before the first filter.
Ask:
“What kind of candidate am I trying to find?”
Examples:
- large profitable companies with attractive valuation;
- liquid momentum stocks in established uptrends;
- high-quality companies experiencing improving earnings;
- dividend stocks with sustainable cash generation;
- small companies with accelerating revenue and sufficient liquidity.
Those are different jobs.
They should not use identical screens.
A screen with no defined objective usually becomes a drawer full of filters collected from articles.
3. Start with the universe
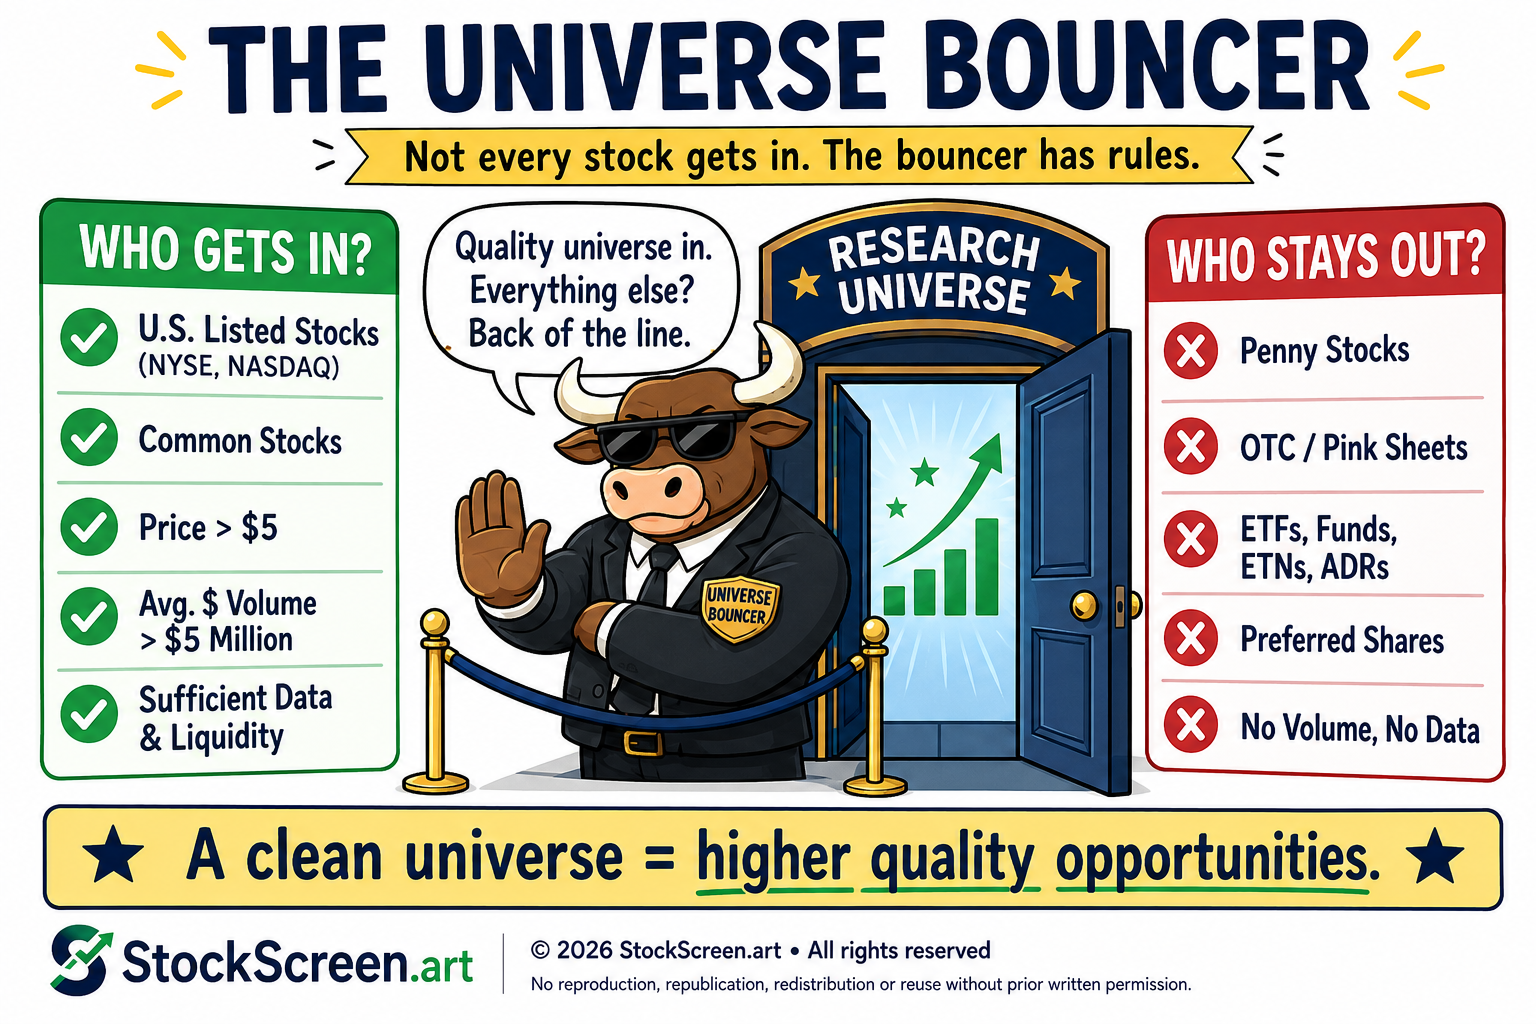
Before asking which stock ranks highest, decide which securities are allowed to participate.
A universe can be restricted by:
- exchange;
- country;
- security type;
- market capitalization;
- share price;
- trading volume;
- availability of reliable data.
If your strategy is designed for liquid U.S. common stocks, there is little value in allowing thinly traded warrants, funds or unrelated foreign instruments into the ranking and hoping they politely remove themselves later.
4. Eligibility rules protect the rest of the process
Universe rules are normally hard filters.
A stock either passes or does not.
For example:
- Allowed exchange: yes / no
- Common stock: yes / no
- Price above minimum: yes / no
- Average liquidity above minimum: yes / no
These rules are not trying to identify the best company.
They define the playing field.
5. Why price filters exist
A minimum price filter can help avoid very low-priced securities that may exhibit:
- large percentage moves from tiny absolute price changes;
- wide spreads;
- thin liquidity;
- greater susceptibility to promotion or manipulation;
- less stable execution.
A $0.10 move in a $50 stock is 0.2%.
A $0.10 move in a $0.50 stock is 20%.
Same ten cents.
Entirely different afternoon.
6. Volume is useful; dollar volume is often more informative
Suppose:
- Stock A trades 1,000,000 shares per day at $1.
- Stock B trades 500,000 shares per day at $100.
Share volume:
- A = 1M shares
- B = 0.5M shares
But approximate dollar volume is:
- A = $1M
- B = $50M
Stock B trades fifty times as much value despite having half the share volume.
Dollar Volume ≈ Price × Trading Volume
For many screening applications, that gives more useful context about practical liquidity.
7. Liquidity is not just a convenience
In Lesson FND-MKT-03 we learned about spreads and liquidity.
The same issue belongs in screening.
A beautiful chart in an illiquid security can become much less beautiful when:
- the bid-ask spread is large;
- your order moves the market;
- exiting quickly becomes difficult;
- quoted prices do not represent realistic execution.
Screening for liquidity helps make the eventual candidates more practically researchable and tradable.
8. Hard filters vs. ranking factors
This distinction makes screening much more flexible.
Hard filter
The stock must satisfy the rule to remain.
Example:
Price > $5
Ranking factor
The stock remains eligible but receives a stronger or weaker score.
Example:
Rank stocks by six-month relative strength.
9. Why ranking can be better than endless filtering
Suppose you require:
- RSI > 55;
- revenue growth > 20%;
- operating margin > 15%;
- FCF margin > 10%;
- P/E < 20;
- price > 50-day MA;
- price > 200-day MA;
- volume > 1M;
- debt/equity < 0.5.
You may get:
Zero stocks.
Congratulations.
You have discovered the world's most exclusive empty portfolio.
Often it is better to:
- use hard rules for truly essential criteria;
- score or rank desirable characteristics;
- review the strongest combinations.
10. Fundamental screening
Fundamental screens use company financial information.
Possible criteria include:
- revenue growth;
- earnings growth;
- gross or operating margins;
- return on equity or capital;
- free cash flow;
- debt levels;
- interest coverage;
- share-count changes.
FINRA emphasizes that individual-stock evaluation should involve due diligence and consideration of company fundamentals rather than a single statistic.
A screen can identify which companies deserve that deeper look.
11. Valuation screening
The previous module gave us several possible filters:
- P/E;
- P/S;
- EV/EBITDA;
- P/B;
- free-cash-flow yield.
But remember VAL-04:
a low multiple can mean opportunity or trouble.
A valuation screen should generally be interpreted beside:
- growth;
- margins;
- cyclicality;
- balance-sheet strength;
- cash generation.
12. Technical screening
Technical filters operate on market data such as price and volume.
Examples include:
- price above a moving average;
- shorter moving average above longer moving average;
- RSI within a chosen range;
- MACD relationship;
- new highs;
- volume expansion;
- breakout conditions;
- volatility;
- relative strength.
FND-SA-01 and FND-SA-02 already introduced many of these ideas.
The key lesson here is architectural:
A technical screen combines rules into a repeatable search process.
13. Quantitative screening
Quantitative screening can combine several variables mathematically.
For example:
Score = Trend + Momentum + Relative Strength + Quality + Liquidity
Each component can have:
- a weight;
- a threshold;
- a normalization method;
- a missing-data rule.
This is where screening starts becoming a model rather than a simple filter list.
14. Scores do not magically create truth
Suppose a model gives:
- Trend: 25 points
- Momentum: 20
- Relative strength: 25
- Liquidity: 10
- Quality: 20
Maximum score:
100
A stock scoring 91 has matched that model extremely well.
It has not acquired a 91% probability of making money unless the system has separately, validly and empirically calibrated that probability.
15. Relative strength is useful because markets are comparative
A stock rising 8% sounds strong.
But what if the overall market rose 20%?
The stock actually lagged substantially.
Relative-strength analysis compares performance with a benchmark or peer group.
This deserves its own lesson next:
FND-SA-04 — Understanding Relative Strength.
16. Sector context matters
Screening can accidentally produce a list dominated by one sector.
Imagine your top 25 momentum stocks contain:
- 18 regional banks;
- 4 insurers;
- 2 asset managers;
- one confused software company.
That may be legitimate market leadership.
It may also mean your “25 opportunities” are largely one economic bet wearing different tickers.
Sector representation can therefore be useful for:
- understanding concentration;
- comparing stocks with relevant peers;
- building a more diverse research list.
Diversification itself does not guarantee profits, but FINRA notes that diversification can reduce the risk of major losses from over-emphasizing one security or asset class.
17. Screening data must be comparable
The output is only as reliable as the inputs.
Common data problems include:
- stale prices;
- missing volume;
- inconsistent sector labels;
- different definitions of non-GAAP measures;
- split-adjustment errors;
- duplicate tickers;
- delisted securities missing from historical tests.
A perfectly coded filter applied to bad data is merely an efficient way to become wrong.
18. Timing matters too
Imagine screening historically using a company’s annual results.
The fiscal year ended December 31.
But the 10-K was not filed until February.
A historical screen run on January 15 cannot legitimately use information investors did not yet have.
That is called a look-ahead problem.
It can make historical results look far better than anything that could actually have been implemented.
19. Survivorship bias
Another historical trap:
Suppose you test a strategy using only companies that exist today.
Companies that failed, delisted or were acquired may be absent.
Your historical universe therefore contains too many survivors.
A strategy should not receive credit for avoiding companies that were quietly removed from the test before it began.
20. Overfitting: when your screen memorizes history
Suppose you test hundreds of variations and discover:
“The best strategy buys stocks with RSI between 53.7 and 57.2, on the second Tuesday after a full moon, provided volume is 1.43 times the 37-day average.”
Very impressive.
Possibly useless.
The more rules you try on historical data, the greater the chance you discover a pattern that happened by accident.
21. Use simple rules before clever ones
A robust first screen might use:
- allowed exchange;
- common-stock security type;
- minimum price;
- minimum liquidity;
- established long-term trend;
- positive relative strength;
- reasonable volatility;
- minimum reward relative to downside.
Each rule has a clear purpose.
Complexity should earn its place.
22. Example: a simple momentum screen
Imagine a fictional 3,000-stock universe.
| Stage | Rule | Stocks Remaining |
|---|---|---|
| Universe | U.S. common stocks | 3,000 |
| Price | Price ≥ $5 | 2,450 |
| Liquidity | Dollar volume ≥ $10M/day | 1,400 |
| Trend | Price > 50DMA > 200DMA | 520 |
| Momentum | Positive momentum criteria | 260 |
| Relative strength | Outperforming benchmark | 125 |
| Risk controls | Volatility / reward criteria | 48 |
| Ranking | Composite score | Top 20 research list |
Notice what the screen did.
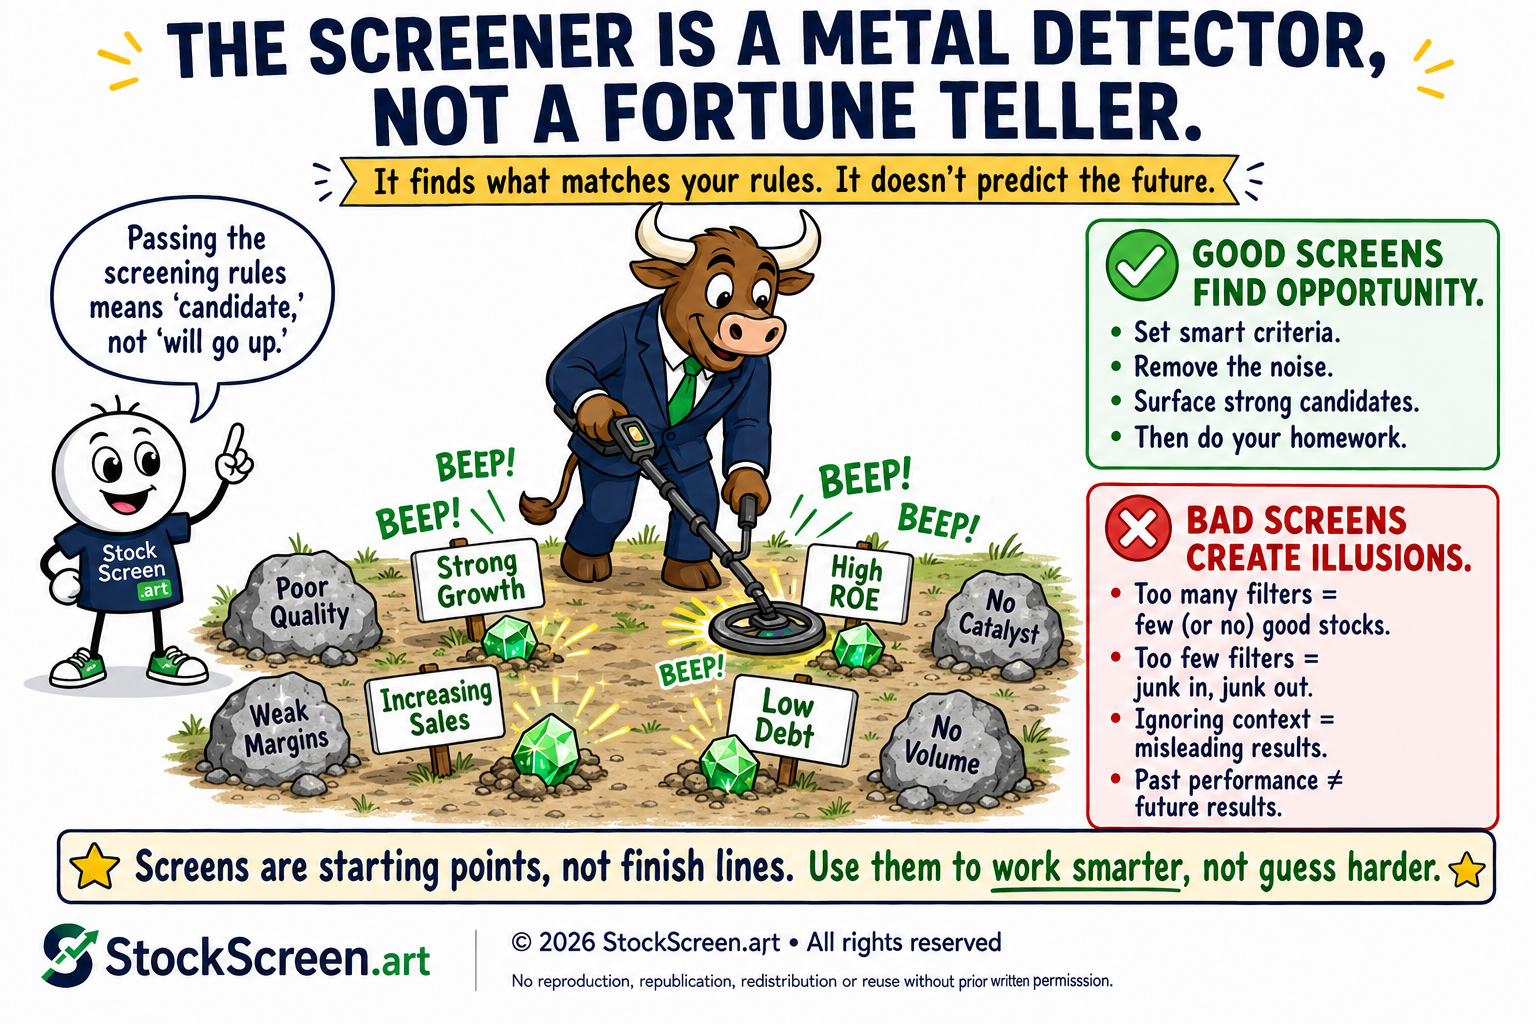
It did not prove the final twenty are good investments.
It made researching twenty stocks more realistic than researching three thousand.
23. Screening and analysis are different jobs
Screening asks:
“Which securities match my rules?”
Analysis asks:
“What is actually happening with this company and this stock?”
After a candidate passes, deeper work can include:
- reading the latest 10-K and 10-Q;
- reviewing recent material company events;
- understanding the business and competitive position;
- checking earnings and cash-flow quality;
- examining debt and liquidity;
- reviewing the chart and current market context;
- planning downside risk.
Investor.gov notes that 10-K and 10-Q filings provide detailed information about a company’s business, risks and financial results, and EDGAR provides free public access to those filings.
24. Why screens go stale
Markets change.
Volatility changes.
Interest rates change.
Industry leadership changes.
Companies mature.
Data sources change.
A screen should therefore be reviewed periodically.
Ask:
- Are the rules still serving the original objective?
- Are thresholds still realistic?
- Did data definitions change?
- Is one filter eliminating nearly everything?
- Is the result list becoming concentrated?
- Are strong candidates repeatedly failing for a reason that no longer makes sense?
25. Do not optimize every disappointing week
Review does not mean:
“Three picks fell. Immediately rewrite the system.”
Markets are noisy.
A valid strategy can have losing periods.
Constantly changing rules after short-term results creates another form of overfitting: the strategy begins chasing whatever just happened.
Change a rule because the logic or evidence changed, not because Tuesday was irritating.
26. Candidate freshness matters
Screens describe a moment in time.
A stock can pass on Monday and fail on Thursday because:
- price changed;
- volume changed;
- earnings were reported;
- a moving-average relationship changed;
- volatility increased;
- the benchmark moved faster.
Screening output should therefore carry a date or timestamp.
“This stock passed sometime recently” is not a rigorous data field.
27. Ranking should be explainable
If Stock A ranks above Stock B, the process should ideally be able to explain why.
For example:
- stronger trend;
- better relative strength;
- healthier momentum;
- lower volatility;
- better liquidity;
- stronger financial quality.
Explainability helps:
- debug the model;
- detect bad data;
- understand candidate differences;
- prevent one hidden factor from dominating unexpectedly.
28. Screening should produce fewer, better questions
The true productivity gain is not:
“I now know the answer.”
It is:
“I now know which twenty companies deserve my next hour.”
That is a much more realistic promise.
29. How this maps to StockScreen.art
StockScreen.art’s broader research philosophy follows the same architecture:
- start with a defined stock universe;
- apply eligibility and liquidity requirements;
- evaluate technical evidence such as trend and momentum;
- compare relative strength;
- consider volatility and risk/reward;
- rank or prioritize stronger candidates;
- perform deeper stock analysis.
The important educational point is not the precise threshold in any one production model.
Thresholds can evolve.
The architecture is what matters:
Universe → Filter → Rank → Validate → Research
30. Build your own simple screen
For practice, imagine your goal is:
“Find liquid U.S. stocks in established uptrends that are outperforming the market.”
A basic design might be:
- Universe: common stocks on selected exchanges.
- Price: remove extremely low-priced securities.
- Liquidity: require adequate average dollar volume.
- Trend: require price above relevant longer-term moving averages.
- Relative strength: require positive performance versus a benchmark.
- Ranking: rank survivors by a combination of trend, momentum and relative strength.
- Research: inspect the top candidates individually.
Notice that we did not specify thresholds here as universal truths.
Thresholds should reflect the strategy, horizon, data and practical constraints.
31. Nine mental models worth keeping
- A screener is a search engine for investment characteristics.
- Define the universe before ranking it.
- Hard filters determine eligibility; ranking factors prioritize survivors.
- Liquidity is part of investability, not cosmetic metadata.
- More filters are not automatically better.
- A scoring model measures its rules, not guaranteed future performance.
- Historical tests must respect what data were actually known at the time.
- Passing a screen creates a candidate, not a recommendation.
- The best screen reduces noise and improves the questions you ask next.
Quick knowledge check
Ten questions. The screen has already removed the ones involving interpretive dance.
1. What is the primary job of a stock screener?
To apply explicit rules to a defined universe and return a smaller group of securities that match those rules.
2. Does passing a screen mean a stock will rise?
No. It means the stock matches the chosen criteria at that time.
3. What is the difference between a hard filter and a ranking factor?
A hard filter determines whether a security remains eligible. A ranking factor scores or orders the eligible survivors.
4. Why can dollar volume be more informative than share volume?
Because it incorporates both share volume and price, giving more context about the amount of trading value changing hands.
5. Why can too many hard filters be a problem?
They can over-constrain the process and eliminate useful candidates, sometimes leaving very few or no results.
6. Does a score of 90 automatically mean a 90% chance of profit?
No. A score measures conformity to the scoring system unless probability has been separately and validly calibrated.
7. What is look-ahead bias?
Using information in a historical test before that information would actually have been available to investors.
8. What is survivorship bias?
A historical distortion caused by evaluating only securities that survived to the present while omitting failed or delisted members of the original universe.
9. What should happen after a stock passes a screen?
Deeper due diligence and analysis of the company, market setup, risks and relevant filings.
10. What is the Foundation screening workflow?
Universe → Filter → Rank → Validate → Research.
Where we go next
Screening tells us which stocks deserve attention.
Now we need a better way to judge whether a stock is actually leading.
Next:
FND-SA-04 — Understanding Relative Strength.
Because a stock being up 10% sounds impressive until you discover everything comparable went up 30%.
Primary sources & further reading
- FINRA — Evaluating Stocks
- Investor.gov — How to Read a 10-K/10-Q
- Investor.gov — Using EDGAR to Research Investments
- FINRA — Asset Allocation and Diversification
- FINRA — What Is Market Timing?