Suppose Stock A gained 12% over the last six months.
That sounds pretty good.
Now suppose the S&P 500 gained 5% over the same period.
Stock A did more than rise.
It outperformed its benchmark.
Now imagine Stock B also gained 12%.
But its relevant peer group gained 24%.
Same 12% return.
Very different story.
Markets are full of numbers that sound impressive until you add context.
Relative strength supplies some of that context.
1. Absolute return answers one question
An absolute return describes how much an investment itself changed over a period.
If a stock rises from $50 to $55, the price return is approximately:
($55 − $50) ÷ $50 = 10%
That tells us what happened to the stock.
It does not tell us whether the stock was strong or weak compared with the market around it.
2. Relative return adds a comparison
A simple relative-performance calculation can be written as:
Relative Performance = Stock Return − Benchmark Return
Example:
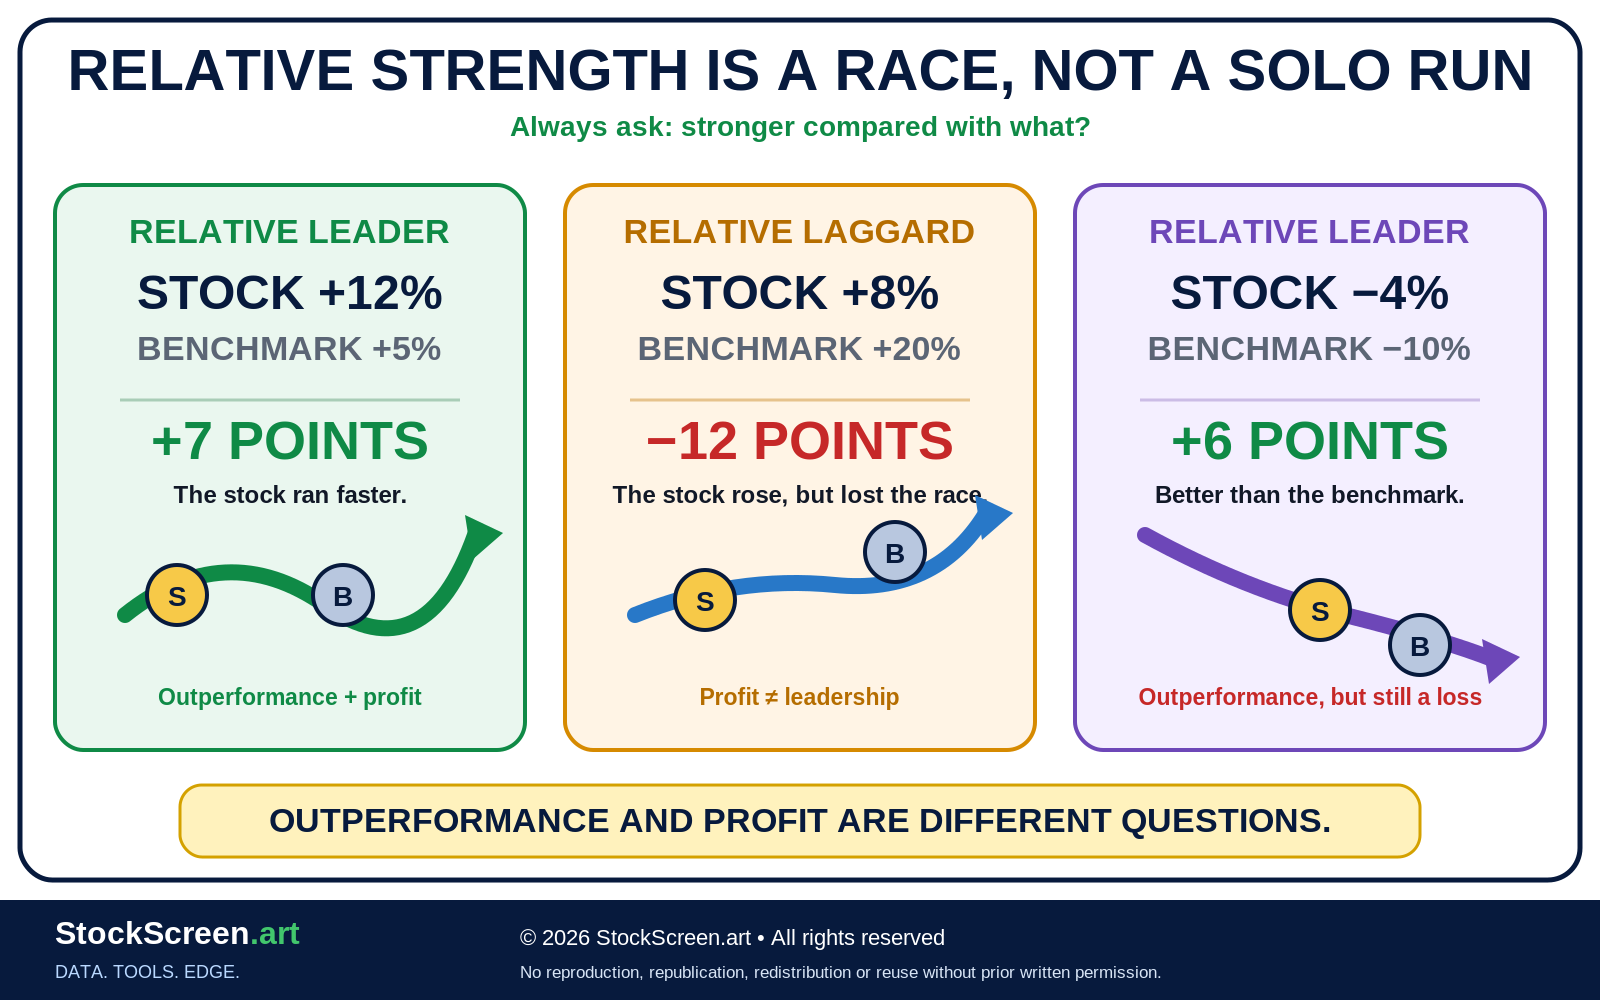
- Stock return: +12%
- Benchmark return: +5%
Relative performance:
+12% − +5% = +7 percentage points
The stock outperformed the benchmark by seven percentage points.
3. A rising stock can still be a laggard
Suppose:
- Stock: +8%
- Benchmark: +20%
Relative performance:
+8% − +20% = −12 percentage points
The stock made money.
It also lagged badly.
Both statements can be true at once.
4. A falling stock can still outperform
Now suppose:
- Stock: −4%
- Benchmark: −10%
Relative performance:
−4% − (−10%) = +6 percentage points
The stock lost money.
But it fell less than the benchmark.
In relative terms, it was stronger.
This is why relative strength should never be confused with absolute profit.
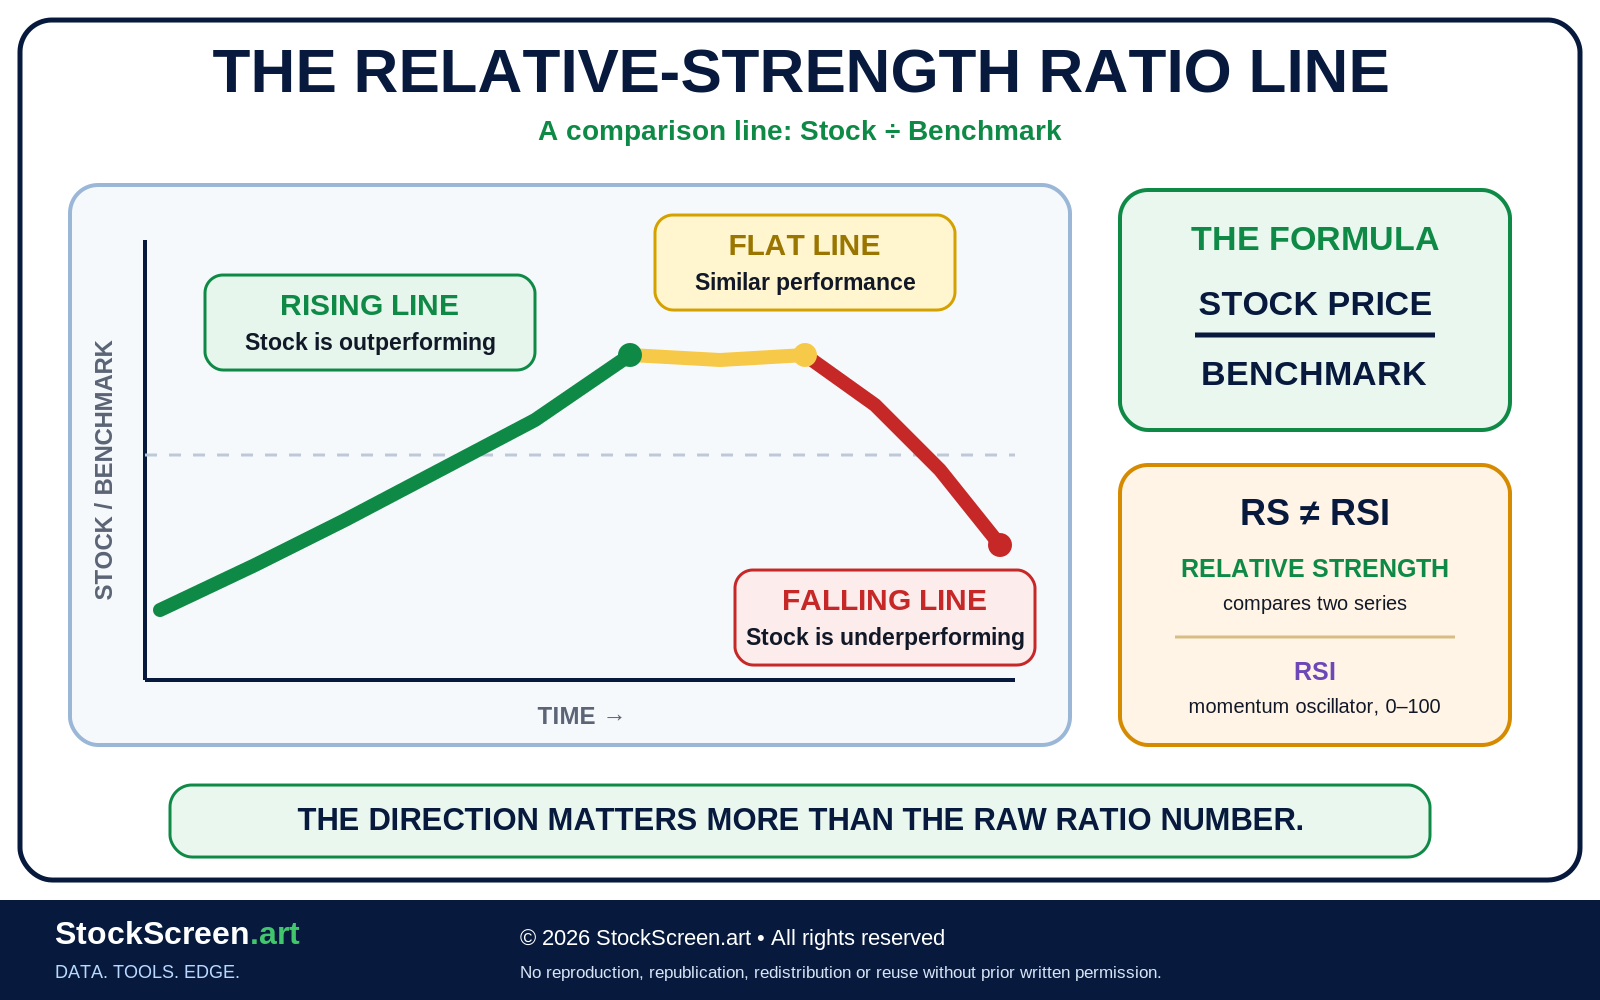
5. Relative strength is not RSI
The names are similar enough to create confusion.
They are not the same thing.
Relative strength
Compares one security with another security, benchmark, peer group or universe.
RSI — Relative Strength Index
RSI is a bounded momentum oscillator, usually scaled from 0 to 100, calculated from a security’s own recent gains and losses.
RSI does not require a benchmark.
6. Benchmark choice is part of the analysis
Relative strength is only as meaningful as the comparison.
Possible benchmarks include:
- a broad-market index;
- a sector index;
- an industry group;
- a peer-company basket;
- another security;
- the median return of an investment universe.
Comparing a small biotechnology company with a utility index may produce a number.
That does not mean it produces useful insight.
7. Broad-market benchmarks answer a broad question
Comparing a stock with a broad index can answer:
“Is this stock outperforming the overall market?”
That can be useful for identifying general leadership.
It may be less useful for determining whether the stock is strong compared with companies facing similar economic conditions.
8. Sector and industry benchmarks answer a narrower question
Suppose an energy stock rises 15% while the broad market rises 5%.
Excellent versus the market.
But suppose the energy sector rises 30%.
The stock may be a broad-market leader and a sector laggard at the same time.
Neither comparison is wrong.
They answer different questions.
9. Use the same measurement window
Relative performance requires a consistent period.
This comparison is valid:
- Stock six-month return
- Benchmark six-month return
This one is not particularly meaningful:
- Stock six-month return
- Benchmark three-month return
Different windows can turn a comparison into arithmetic theatre.
10. Lookback period changes what “strong” means
A stock can be:
- very strong over one month;
- average over three months;
- weak over twelve months.
That is not contradictory.
It may simply describe a recent turnaround inside a longer period of weakness.
Common relative-strength windows might include:
- one month;
- three months;
- six months;
- twelve months.
The correct horizon depends on the strategy.
11. Multi-horizon relative strength can be more informative
Instead of relying on one return period, a model can examine several.
For example:
| Window | Stock | Benchmark | Relative |
|---|---|---|---|
| 1 month | +6% | +2% | +4 pts |
| 3 months | +14% | +8% | +6 pts |
| 6 months | +22% | +15% | +7 pts |
Consistent outperformance across several horizons can tell a different story from one sudden burst.
12. The relative-strength ratio line
Another common approach compares prices directly using a ratio:
Relative-Strength Ratio = Stock Price ÷ Benchmark Level
The ratio itself is less important than its direction.
- Rising ratio: the stock is outperforming the benchmark.
- Falling ratio: the stock is underperforming the benchmark.
- Flat ratio: performance is roughly similar.
13. The ratio line can rise while the stock falls
This catches people the first time.
Imagine:
- Stock falls 3%
- Benchmark falls 12%
The stock is losing less.
Its relative-strength ratio can rise even while its own chart is falling.
That is relative leadership inside a weak environment.
14. A strong price chart and a strong relative chart are different evidence
Consider four combinations:
| Price Trend | Relative Trend | Possible Interpretation |
|---|---|---|
| Rising | Rising | Absolute and relative strength |
| Rising | Falling | Price up, but lagging benchmark |
| Falling | Rising | Declining, but holding up better than benchmark |
| Falling | Falling | Absolute and relative weakness |
Relative strength adds a second dimension.
It does not replace the first one.
15. Cross-sectional relative strength ranks a group
Relative strength can also be used to compare many securities at once.
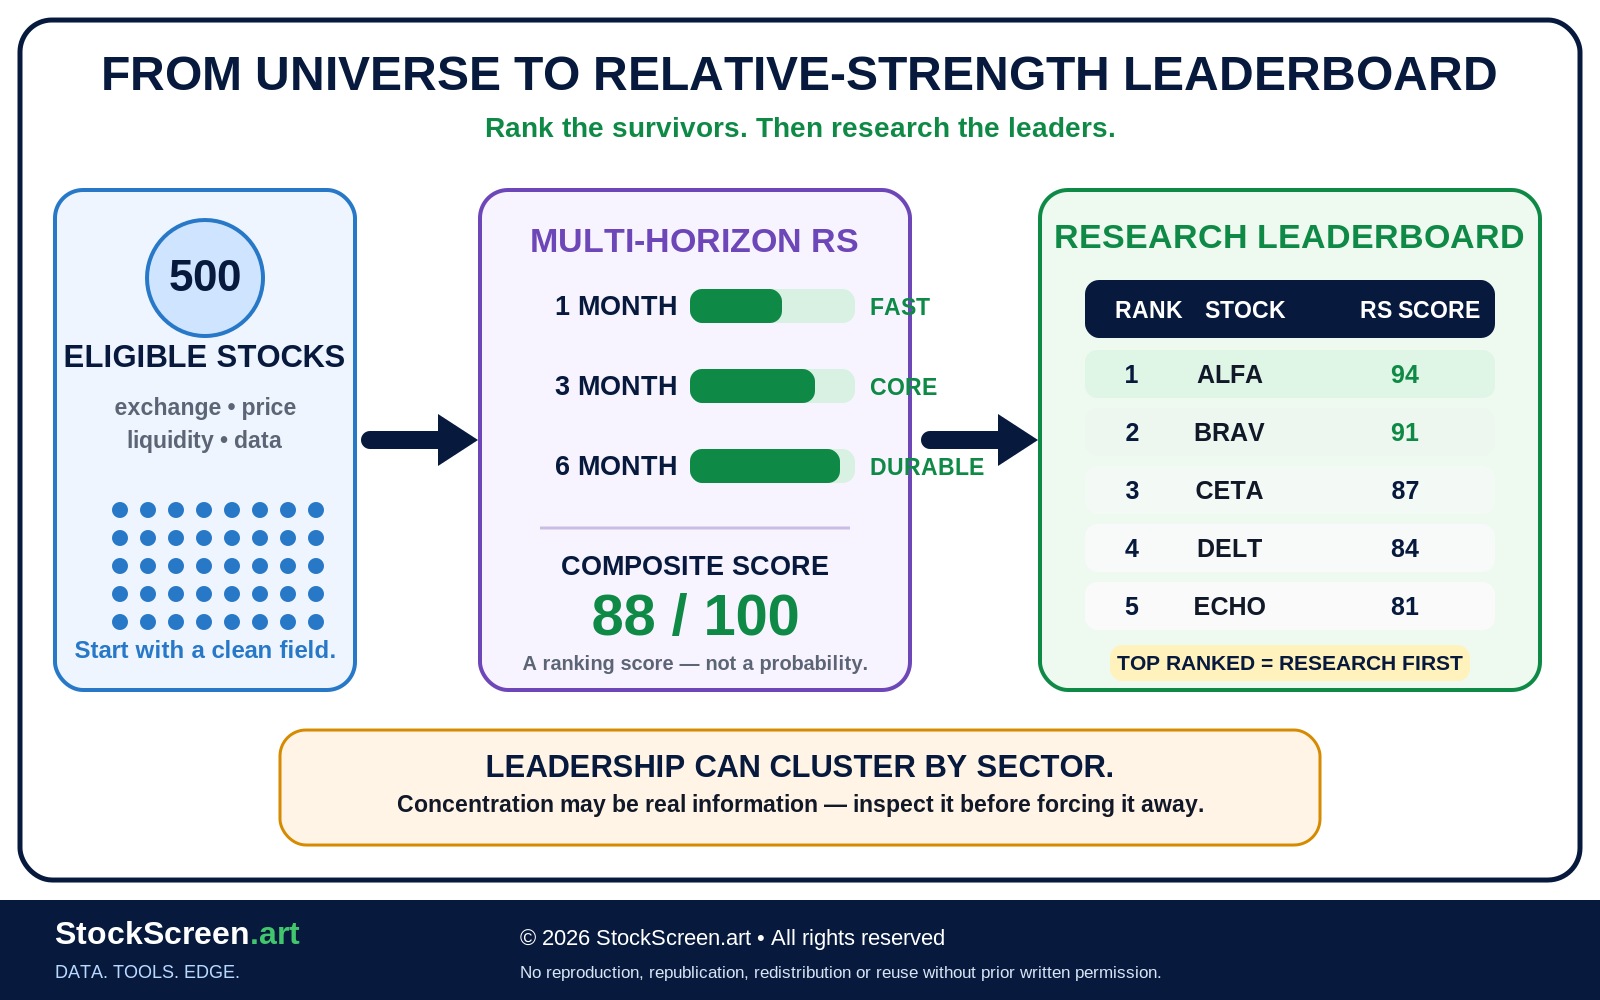
Suppose 500 stocks are eligible.
You can rank them by six-month return, benchmark-relative return, or another consistent momentum measure.
The strongest might receive the highest rank.
The weakest receive the lowest.
This is called a cross-sectional comparison because each security is judged relative to the others at the same point in time.
16. Ranking is not the same as filtering
Lesson FND-SA-03 separated hard filters from ranking factors.
Relative strength often works well as a ranking factor.
Example:
- Require allowed exchange.
- Require common stock.
- Require minimum price.
- Require minimum liquidity.
- Require an established trend.
- Rank survivors by relative strength.
The first rules decide who is eligible.
Relative strength helps decide who deserves attention first.
17. A rank tells you position, not distance
Suppose Stock A ranks 1st and Stock B ranks 2nd.
That does not tell you whether their scores are:
- 99 and 98;
- 99 and 70;
- 51 and 50.
Rank tells you order.
It does not necessarily tell you how far apart the candidates are.
18. A score is not automatically a probability
Suppose a system assigns a relative-strength score of 92 out of 100.
That may mean the stock ranks very highly under the scoring method.
It does not automatically mean:
“92% chance the stock will rise.”
Probability requires separate calibration and validation.
19. Percentile ranks can make large universes easier to read
Suppose a stock has a relative-strength percentile of 95.
A simple interpretation might be:
It ranked stronger than roughly 95% of the securities in the comparison universe under that measurement method.
The exact meaning still depends on how the percentile was constructed.
Always ask:
- Which universe?
- Which period?
- Which return definition?
- Which benchmark?
- Which date?
20. Universe design changes the ranking
Ranking 50 utility stocks is different from ranking 3,000 U.S. common stocks.
A stock can rank highly inside a weak industry and poorly inside the full market.
Relative strength always contains an implied question:
“Relative to what?”
21. Sector concentration can create false comfort
Suppose your top twenty relative-strength stocks include:
- twelve semiconductor companies;
- five semiconductor-equipment companies;
- two chip-design companies;
- one company that sells snacks in the lobby of a semiconductor conference.
You may have twenty tickers.
Economically, you may have one large theme.
Sector and industry context help reveal that concentration.
22. Relative strength can rotate
Leadership is not permanent.
A sector that leads for six months can lag during the next six.
Individual companies can also move in and out of leadership as:
- earnings expectations change;
- interest rates change;
- commodity prices move;
- industry demand shifts;
- investor risk appetite changes.
Relative strength therefore describes a current or historical relationship.
It is not a permanent personality trait.
23. Freshness matters
A relative-strength ranking should carry a date.
A stock that ranked 5th three weeks ago may rank 85th today.
Reasons include:
- the stock moved;
- the benchmark moved;
- earnings changed expectations;
- another sector took leadership;
- the lookback window rolled forward.
“Strong recently” is not precise enough for a quantitative process.
24. Price adjustments matter
Historical price data may need adjustment for events such as stock splits.
Depending on the analysis, dividends may also matter if the goal is to compare total return rather than price return.
If the stock uses one return convention and the benchmark uses another, the comparison can become inconsistent.
Comparability matters more than decorative decimal places.
25. Missing data can distort ranks
Suppose a 12-month ranking requires 252 trading days of history.
A newly listed company may not have enough observations.
The system needs an explicit rule:
- exclude it;
- use a shorter window;
- assign a missing value;
- place it in a separate cohort.
Quietly treating missing history as zero can create nonsense with excellent formatting.
26. Look-ahead bias can sneak into relative-strength research
Historical testing must use only information that would actually have been available at that time.
Examples of look-ahead mistakes include:
- using tomorrow's close in today's ranking;
- using a future constituent list for an old index date;
- using financial data before it was published;
- rebalancing at a price that could not have been known when the decision was made.
The model should not own a time machine unless the brokerage account comes with one too.
27. Survivorship bias can make leadership look cleaner than it was
If a historical universe contains only companies that survived until today, failed or delisted securities may disappear from the test.
That can make historical leader selection look artificially strong.
A fair test should reconstruct the universe that actually existed at the time as closely as practical.
28. Relative strength and volatility are different dimensions
Two stocks can have identical six-month returns with very different paths.
One may rise steadily.
The other may alternate between celebration and cardiac stress every Tuesday.
Relative strength says something about comparative return.
It does not fully describe volatility, drawdown or trading risk.
29. Relative strength and quality are also different dimensions
A weak business can have excellent momentum.
A high-quality business can temporarily lag.
Relative strength measures market behavior.
It does not directly tell you:
- whether revenue is growing;
- whether free cash flow is healthy;
- whether debt is manageable;
- whether valuation is attractive;
- whether management is competent.
Those require other evidence.
30. Relative strength works well inside a layered process
A practical research architecture might look like this:
- Universe: define eligible securities.
- Liquidity: remove impractical candidates.
- Trend: identify acceptable technical structure.
- Relative strength: compare survivors with the market or peers.
- Risk: review volatility and downside structure.
- Quality: examine business and financial evidence.
- Ranking: prioritize candidates.
- Research: investigate the strongest ideas individually.
No single layer has to pretend to be the entire investment process.
31. Example: ranking a small universe
Imagine five eligible stocks measured over six months against a benchmark that returned 10%.
| Stock | 6-Month Return | Benchmark | Relative Performance | Rank |
|---|---|---|---|---|
| A | +28% | +10% | +18 pts | 1 |
| B | +21% | +10% | +11 pts | 2 |
| C | +13% | +10% | +3 pts | 3 |
| D | +7% | +10% | −3 pts | 4 |
| E | −2% | +10% | −12 pts | 5 |
Stock A is the strongest relative performer in this small group.
That does not mean we buy it automatically.
We still need to understand:
- trend quality;
- liquidity;
- volatility;
- valuation;
- business quality;
- upcoming events;
- downside risk.
32. Eight mental models worth keeping
- Relative strength is a comparison, not a prediction.
- Always ask “relative to what?”
- Use the same measurement window for both sides of the comparison.
- A rising stock can be a laggard; a falling stock can be a relative leader.
- Relative strength is not RSI.
- Rank identifies order, not certainty or probability.
- Leadership changes, so relative-strength data need a date.
- Use relative strength with other evidence rather than asking it to do every job.
Quick knowledge check
Ten questions. No stopwatch. Relative strength is competitive enough already.
1. What does relative strength compare?
It compares the performance of one security with a benchmark, peer, sector, industry group or other defined comparison over the same period.
2. A stock rises 8% while its benchmark rises 20%. Is the stock a relative leader?
No. It has a positive absolute return but underperformed the benchmark by 12 percentage points.
3. Can a falling stock have positive relative strength?
Yes. If the stock falls less than its benchmark, it can outperform on a relative basis while still losing money.
4. Is relative strength the same as RSI?
No. Relative strength compares performance with something else. RSI is a bounded momentum oscillator calculated from the security's own recent gains and losses.
5. What does a rising relative-strength ratio line generally mean?
The stock is outperforming the chosen benchmark over that portion of the chart.
6. Why does benchmark choice matter?
Different benchmarks answer different comparative questions. A broad-market comparison and a sector comparison can produce different but valid conclusions.
7. What is cross-sectional relative strength?
It compares or ranks multiple securities against one another at the same point in time using a consistent measurement method.
8. Does a relative-strength rank of 95 mean a 95% probability of profit?
No. A rank or percentile describes comparative position under the ranking method. Probability requires separate empirical calibration.
9. Why should relative-strength output carry a date?
Because prices, benchmarks, lookback windows and leadership change over time, so rankings can become stale quickly.
10. Where does relative strength fit in the Foundation screening process?
After defining an eligible, liquid universe, relative strength can help rank or prioritize candidates alongside trend, momentum, risk and other evidence.
Where we go next
Relative strength tells us whether a stock is leading or lagging.
Next we need to ask whether participation supports that leadership.
Next:
FND-SA-05 — Volume, Breakouts and Confirmation.
Because leadership is more convincing when price moves are backed by participation. Next we will look at how volume can confirm, question or weaken a breakout.
Primary sources & further reading
- FINRA — Evaluating Stocks
- Investor.gov — Market Index
- Investor.gov — Using EDGAR to Research Investments
- FINRA — Asset Allocation and Diversification