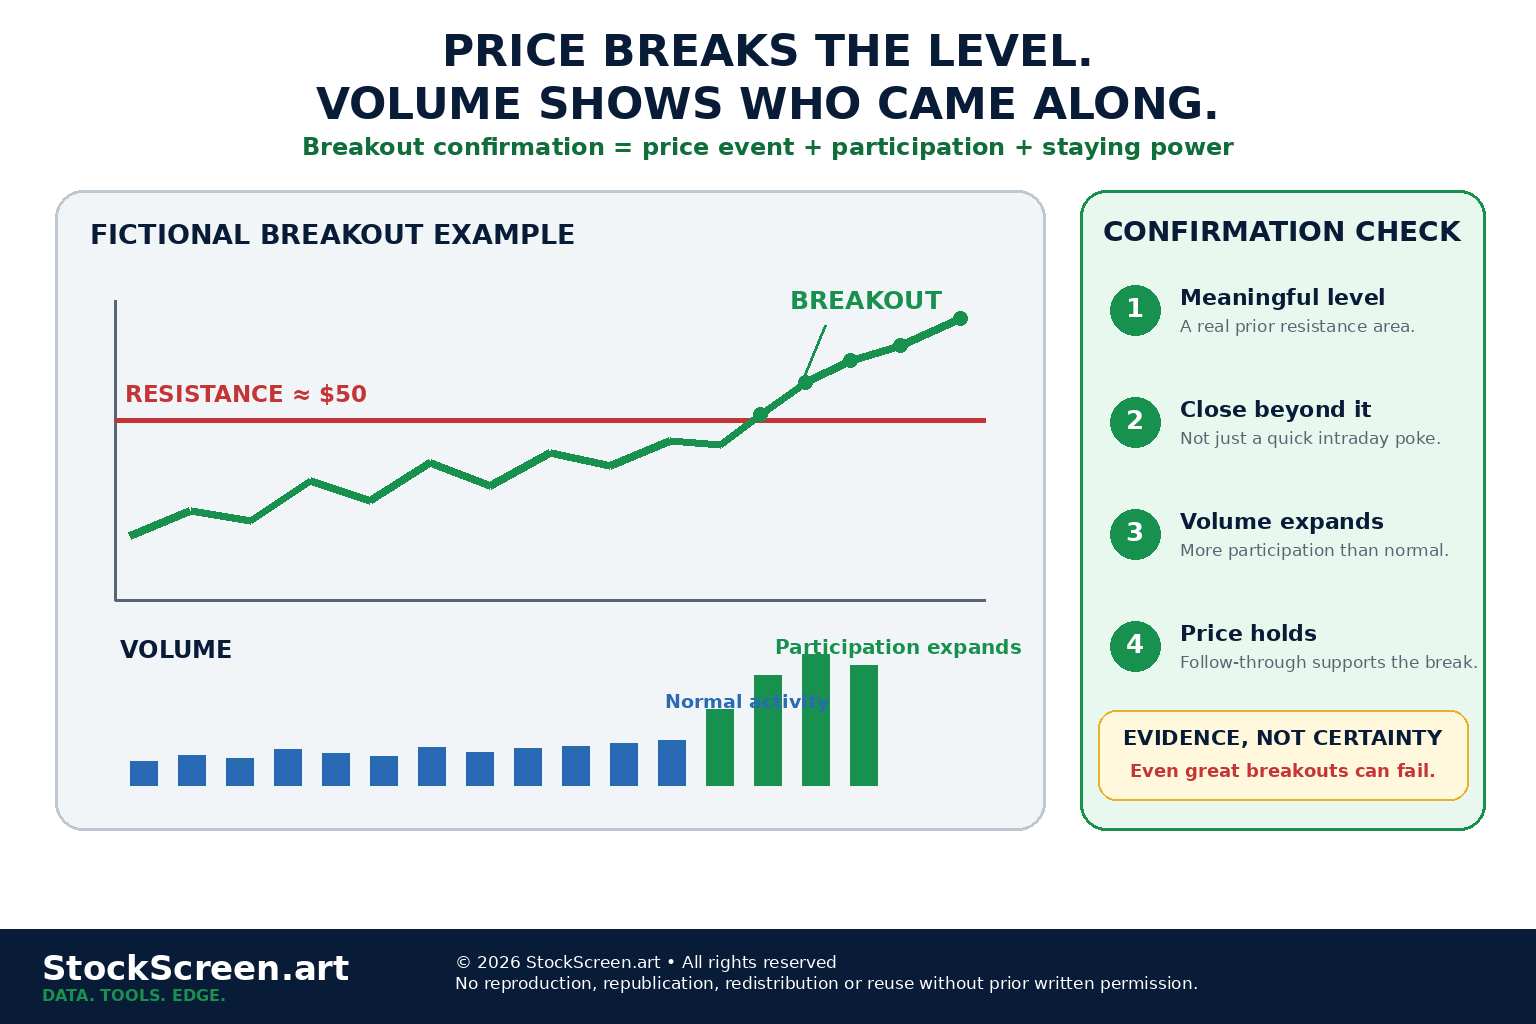
Imagine a stock has spent three months banging its head against $50.
Every rally reaches roughly the same area.
Every rally retreats.
Then one Tuesday morning the stock finally trades at $51.
Breakout?
Maybe.
Now add one more fact:
- the stock normally trades 800,000 shares per day;
- today it trades 4.2 million shares;
- it closes at $51.40 instead of immediately falling back below $50.
That does not make the breakout guaranteed.
It does make the move more interesting.
This lesson is about that second layer of evidence.
1. What trading volume actually measures
Trading volume measures the amount of a security that changed hands during a specified period.
On a daily stock chart, the volume bar normally represents the number of shares traded during that trading day.
Investor.gov notes that historical stock data commonly includes opening price, closing price, daily high, daily low and trading volume.
Volume is therefore not an exotic indicator.
It is basic market data.
2. Volume is activity, not opinion
If 5 million shares trade today, we know trading activity was substantial.
We do not automatically know:
- that “smart money” was buying;
- that institutions were accumulating;
- that sellers were exhausted;
- that tomorrow will be higher;
- that the move was healthy.
Every completed trade has both a buyer and a seller.
Volume tells us that they were very busy disagreeing.
3. Raw volume needs a baseline
Is 2 million shares a lot?
There is no useful answer without context.
For one stock, 2 million shares may be sleepy.
For another, it may be extraordinary.
This is why analysts often compare today’s volume with the security’s own recent average.
Relative Volume ≈ Current Volume ÷ Typical Volume
If a stock normally trades 1 million shares and trades 3 million today:
Relative Volume ≈ 3.0×
The exact averaging method can vary.
The idea is simply to ask whether participation is ordinary or unusual for that security.
4. Average volume is not a universal truth
You might compare volume with:
- a 20-day average;
- a 30-day average;
- a 50-day average;
- the median instead of the mean;
- the same time of day for intraday analysis.
Different definitions can produce different “relative volume” numbers.
Consistency matters more than pretending one window was handed down on a stone tablet.
5. Volume and liquidity are related, but not identical
High trading volume can contribute to liquidity, but liquidity is broader.
FINRA describes a liquid market as one in which participants can generally buy or sell without significantly affecting price.
Practical liquidity can also depend on:
- bid-ask spread;
- order-book depth;
- volatility;
- trade size;
- market conditions.
A high-volume day does not magically repair a normally terrible market.
6. Dollar volume adds another useful perspective
Lesson FND-SA-03 introduced dollar volume:
Dollar Volume ≈ Price × Share Volume
A $100 stock trading 500,000 shares represents roughly $50 million of trading value.
A $1 stock trading 2 million shares represents roughly $2 million.
The second stock has four times the share volume but far less trading value.
That distinction can matter when you are evaluating whether a breakout is practically tradable.
7. What is a breakout?
A breakout is a price move beyond an area that had previously constrained price.
Common breakout reference areas include:
- a prior high;
- the upper boundary of a trading range;
- a well-tested resistance zone;
- a consolidation pattern;
- another objectively defined price structure.
The important word is meaningful.
Price moving above a random number you drew because it looked aesthetically pleasing is not much of a market event.
8. Resistance is usually an area, not a laser beam
Real markets are messy.
If previous rallies stalled at $49.80, $50.05 and $50.22, it may be more useful to think of resistance as a zone around $50 than as a magical line at exactly $50.0000.
This prevents false precision.
It also makes the next question more sensible:
Did price actually escape the area, or merely poke its nose through it?
9. Intraday penetration is not the same as confirmation
Suppose resistance is near $50.
- Price trades at $50.35 at 10:15 a.m.
- By the close, price is back at $49.40.
The stock technically traded above resistance.
But the market rejected the move before the session ended.
Many breakout approaches therefore care about where the security closes, not merely the highest intraday print.
10. Why volume can strengthen breakout evidence
A breakout represents a change in price behavior.
If that change occurs while participation also expands substantially, two things changed at once:
- price moved beyond an important area;
- trading activity became unusually strong.
That combination can be more persuasive than a tiny price move on unusually quiet trading.
It is evidence of participation.
It is not a warranty card.
11. Light-volume breakouts are not automatically false
Be careful with rigid rules.
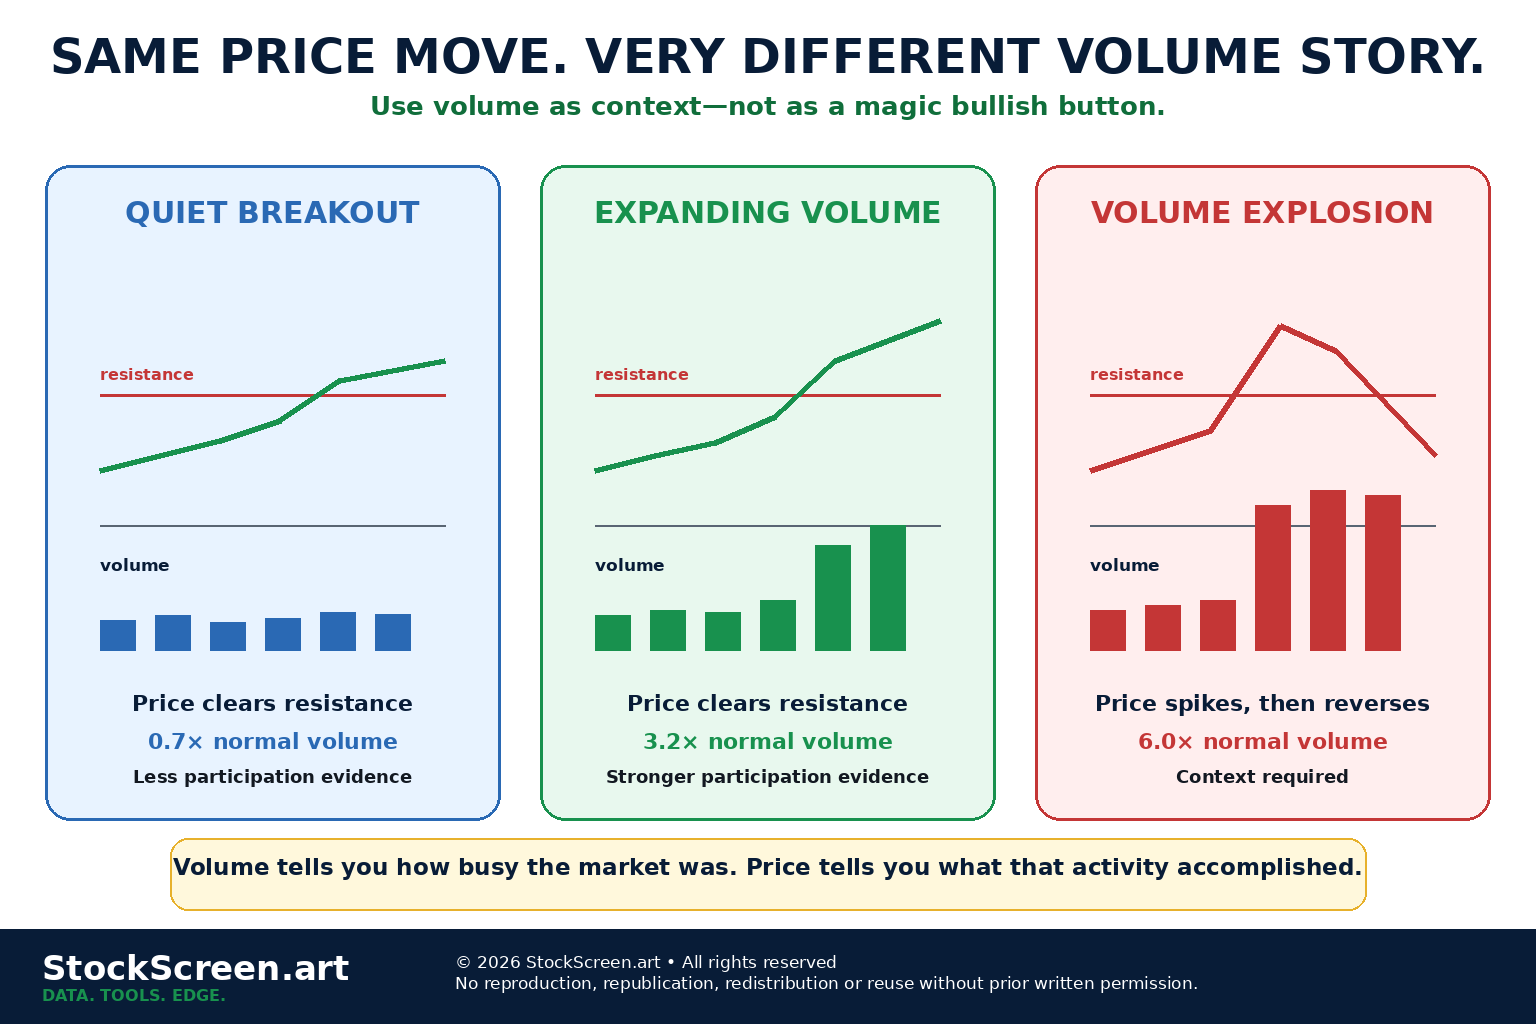
A breakout on average or below-average volume can still succeed.
Markets are probabilistic.
Low volume simply gives you less participation evidence than a comparable move with unusually strong activity.
12. High volume is not automatically bullish
Imagine a stock breaks above resistance in the morning on huge volume.
Then it reverses violently and closes below the breakout level.
The volume was real.
The price response was also real.
High activity combined with rejection can be evidence that supply appeared aggressively at higher prices.
Volume has no permanent green arrow attached to it.
13. Price direction and closing location matter
When reviewing a high-volume session, ask:
- Did price close near the session high or near the low?
- Did it remain beyond the breakout area?
- Was the session strongly positive, flat or negative?
- Was the move orderly or violently erratic?
A large volume bar is much more useful when read beside the price bar that created it.
14. Follow-through is another form of confirmation
A breakout can look excellent on day one and collapse on day two.
Follow-through asks what happened after the initial break.
Useful questions include:
- Did price hold above the former resistance area?
- Did buyers continue to accept higher prices?
- Did the stock immediately fall back into its old range?
- Did volume normalize without price collapsing?
A breakout that survives subsequent trading has more evidence behind it than one that lasts twelve enthusiastic minutes.
15. The retest
Sometimes price breaks resistance, rises, then returns toward the old breakout area.
Traders often call this a retest.
The former resistance area may behave as support.
Or it may not.
If price falls decisively back below the level, the original breakout thesis becomes weaker.
The market has just provided new information.
16. Failed breakouts matter
A failed breakout occurs when price moves beyond a reference area but cannot sustain the move.
Common signs include:
- quick return below resistance;
- weak close after an intraday break;
- lack of follow-through;
- heavy selling after the breakout;
- re-entry into the prior trading range.
Failure is not merely disappointing.
It is information about the market’s willingness to accept the new price area.
17. Breakouts can fail even with enormous volume
This deserves repetition.
High-volume confirmation improves evidence.
It does not guarantee direction.
A major news event can produce massive turnover while investors violently disagree about value.
Sometimes the result is a durable trend.
Sometimes the result is a chart that looks like it was designed by a seismograph during an earthquake.
18. Earnings can completely change normal volume
Earnings reports frequently create unusually large price gaps and volume.
That means “three times average volume” after earnings is not the same context as “three times average volume” on an otherwise quiet Tuesday.
The event itself explains why participation changed.
You still need to evaluate the market’s response:
- gap direction;
- closing location;
- range;
- follow-through;
- new information in the earnings report.
19. News-driven volume needs context
Volume can surge because of:
- earnings;
- guidance changes;
- mergers or acquisitions;
- regulatory decisions;
- analyst actions;
- index additions or deletions;
- financing announcements;
- product news;
- speculation or promotion.
Investor.gov specifically warns that unexplained dramatic changes in price or trading volume in microcap stocks can be a manipulation red flag.
“Volume exploded” is therefore a reason to investigate.
It is not automatically a reason to celebrate.
20. Thin stocks can manufacture impressive-looking percentages
Illiquid securities can move sharply because relatively little capital is required to move the quoted price.
A 15% breakout sounds exciting.
A 15% breakout with a giant spread and almost no depth may be considerably less exciting when you try to trade it.
This is why the StockScreen.art screening architecture applies eligibility and liquidity rules before technical ranking.
21. Volume should be compared over matching periods
Do not compare partial-day volume at 10:00 a.m. directly with completed full-day volume without adjustment.
Of course the partial session is smaller.
Intraday systems often compare activity with the historical volume normally traded by the same time of day.
Apples are more useful when compared with apples rather than with Tuesday afternoon watermelons.
22. Corporate actions can distort the data
Stock splits and other corporate actions can change historical price and share-volume relationships.
Data vendors may adjust historical series differently.
Before building a quantitative volume rule, verify:
- whether prices are split-adjusted;
- whether volume is adjusted consistently;
- whether missing sessions exist;
- whether ticker changes or mergers created discontinuities.
A precise formula applied to inconsistent history remains precisely wrong.
23. A simple breakout-confirmation workflow
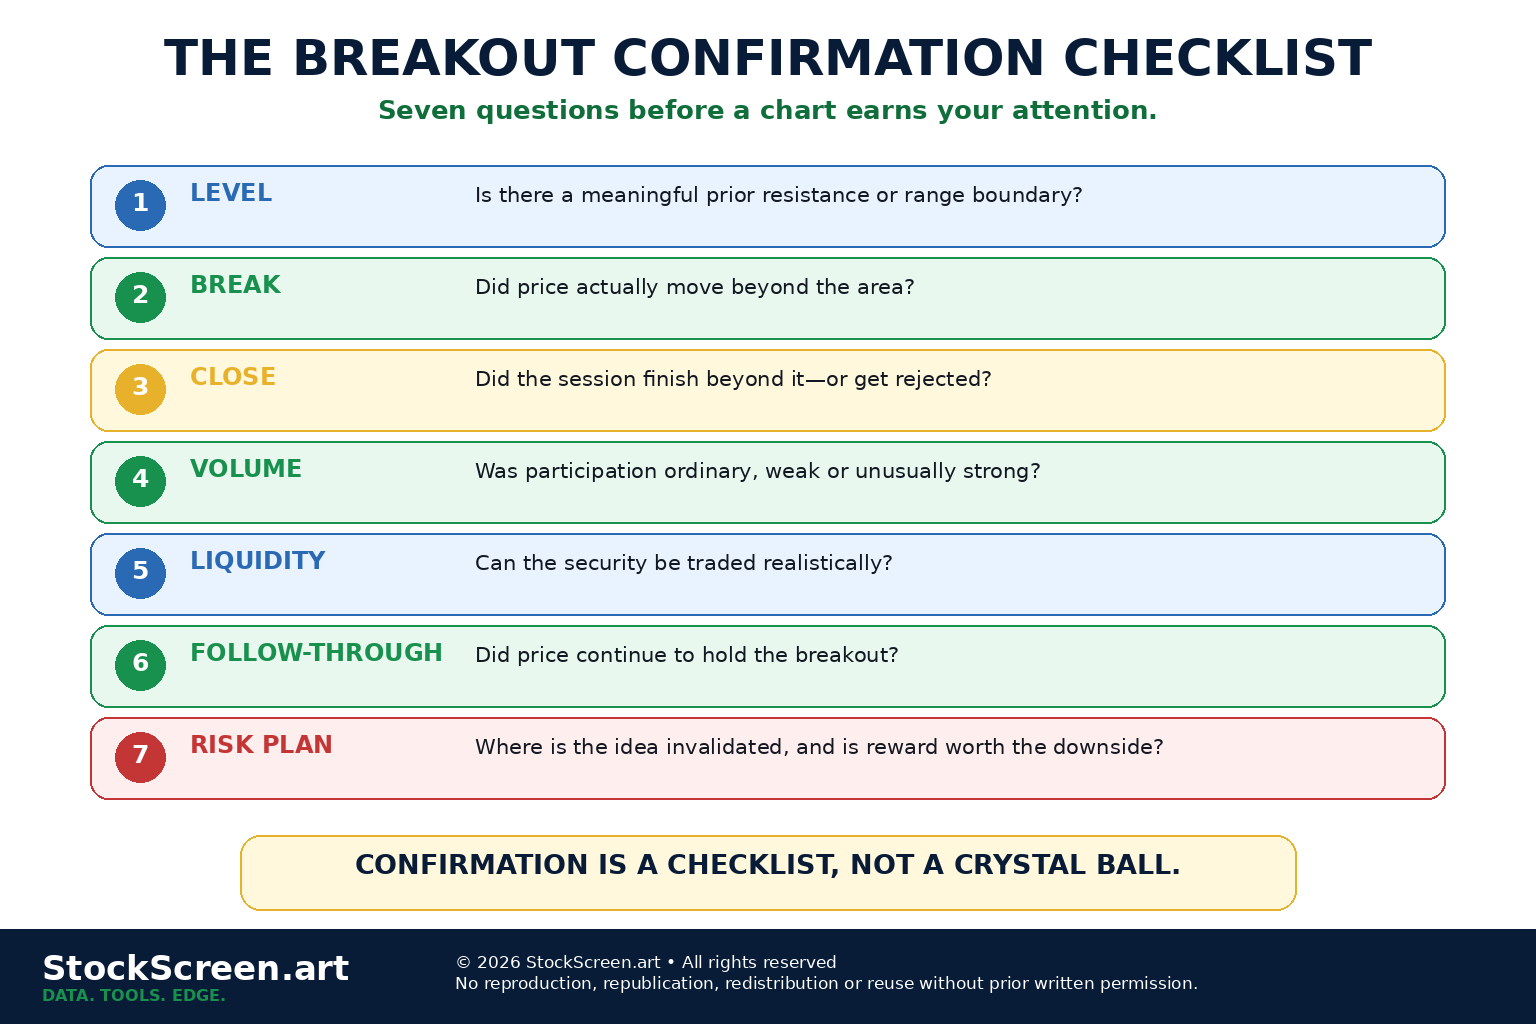
A practical research sequence can be:
- Define the level: identify a meaningful prior resistance or range boundary.
- Observe the break: determine whether price actually moved beyond the area.
- Check the close: did price finish beyond the level or get rejected?
- Check volume: was participation normal, weak or unusually strong?
- Check liquidity: could the security be traded realistically?
- Check context: earnings, news, market regime, sector behavior and broader trend.
- Check follow-through: did the market continue to accept the breakout?
- Plan risk: where is the idea invalidated, and is the potential reward worth the downside?
24. Example: stronger confirmation
Consider a fictional stock:
| Evidence | Observation |
|---|---|
| Prior resistance | $50 area tested several times |
| Breakout close | $51.40 |
| 20-day average volume | 800,000 shares |
| Breakout-day volume | 4.2 million shares |
| Relative volume | Approximately 5.25× normal |
| Liquidity | Tight spread and adequate dollar volume |
| Next session | Price holds above $50 |
This does not prove the trade will work.
It does provide several pieces of evidence pointing in the same direction.
25. Example: weaker confirmation
Now consider another fictional stock:
| Evidence | Observation |
|---|---|
| Prior resistance | $20 area |
| Intraday high | $20.45 |
| Closing price | $19.60 |
| Average volume | 1.5 million shares |
| Breakout-day volume | 900,000 shares |
| Spread | Wider than normal |
| Next session | Price remains inside old range |
Price briefly crossed the line.
The broader evidence did not confirm acceptance above it.
26. Volume can confirm downside breaks too
Confirmation is not only bullish.
If a stock breaks important support on unusually heavy volume and closes near the low, that can provide evidence of strong participation in the downside move.
The same analytical logic applies:
Price event + participation + closing behavior + follow-through
Markets do not reserve volume for optimistic occasions.
27. Do not confuse confirmation with causation
If a breakout succeeds after volume expanded, we can say the breakout was accompanied by strong trading activity.
We should be more careful about claiming:
“High volume caused the stock to rise.”
Market prices reflect interacting orders, information, expectations and constraints.
Volume is part of the evidence, not a complete causal explanation.
28. Avoid magical thresholds
Rules such as:
“A breakout is valid only if volume is exactly 1.5× average.”
can be useful as operational definitions in a specific system.
They are not laws of finance.
Thresholds should reflect:
- strategy horizon;
- security universe;
- liquidity;
- historical evidence;
- data quality;
- transaction constraints.
A rule should earn its place.
29. How volume fits with relative strength
Lesson FND-SA-04 asked whether a stock was leading or lagging its benchmark.
Volume adds another question:
Is the price move attracting meaningful participation?
A stock can therefore show:
- strong relative strength but weak breakout participation;
- strong volume but poor relative strength;
- both leadership and expanding participation;
- neither.
Multiple dimensions are more informative than one heroic indicator trying to do every job.
30. How this maps to StockScreen.art
Within a structured screening process, volume-related evidence can support several jobs:
- eligibility: ensure minimum liquidity;
- confirmation: identify unusual participation around price moves;
- ranking: reward candidates whose price strength is supported by broader evidence;
- risk review: flag thin or erratic securities for caution.
The educational architecture is:
Level → Break → Participation → Hold → Risk Plan
None of those steps guarantees the next price move.
Together, they create a more disciplined research process.
31. Nine mental models worth keeping
- Volume measures activity, not truth.
- Normal volume is security-specific; always use a baseline.
- A breakout needs a meaningful level before it can mean anything.
- A close beyond resistance is stronger evidence than a momentary intraday poke.
- Expanding volume can strengthen confirmation, but cannot guarantee success.
- High volume can accompany buying, selling, news, speculation or outright chaos.
- Follow-through matters because markets get a vote after breakout day.
- Liquidity determines whether a beautiful chart is practically tradable.
- Confirmation should lead to risk planning, not confidence theater.
Quick knowledge check
Ten questions. Volume is high. Panic is unnecessary.
1. What does trading volume measure?
The amount of a security traded during a specified period, such as the number of shares traded during a day.
2. Why is raw volume difficult to interpret by itself?
Because the same number of shares can be normal for one security and extraordinary for another. Volume needs a baseline and price context.
3. What is relative volume?
A comparison of current trading activity with a chosen measure of the security’s normal trading activity.
4. What is a breakout?
A move beyond a meaningful prior price area such as resistance, a range boundary or a prior high.
5. Does high volume guarantee a breakout will succeed?
No. High volume can strengthen evidence of participation, but high-volume breakouts can still fail.
6. Why can the closing price matter when judging a breakout?
A stock can trade briefly beyond resistance and then be rejected. A close beyond the area provides stronger evidence that the market accepted the new price region.
7. What is follow-through?
Subsequent price behavior showing whether the security continues to hold or advance beyond the breakout area rather than immediately falling back.
8. Why should a dramatic volume spike be investigated rather than automatically treated as bullish?
Because volume can surge for many reasons, including earnings, corporate news, index changes, speculation, promotion or heavy selling.
9. Why does liquidity matter in breakout analysis?
Thin securities can show dramatic price changes while having wide spreads, poor depth and difficult execution, making the apparent setup less practical.
10. What is the Foundation confirmation workflow?
Level → Break → Participation → Hold → Risk Plan.
Where we go next
We now know how to identify a price break and ask whether participation supports it.
The next question is less glamorous and much more important:
“If I am wrong, what happens?”
Next:
FND-SA-06 — Risk/Reward and Position Planning.
Because a great-looking setup without a downside plan is just confidence wearing expensive shoes.
Primary sources & further reading
- Investor.gov — Stock Quotes
- FINRA — Investing Basics
- FINRA — Key Terms for Tough Times: Liquidity
- Investor.gov — Microcap Stock Basics: Risk
- U.S. SEC — Glossary: Liquidity