A stock can have strong relative strength.
It can break resistance on expanding volume.
It can look so attractive that your mouse cursor begins hovering suspiciously close to the Buy button.
We still have one important question:
What happens if the idea is wrong?
That question is the beginning of position planning.
Planning does not remove uncertainty.
It gives uncertainty boundaries.
1. Start with what would make the idea wrong
Many inexperienced plans begin with a target.
“If this stock reaches $80, I will make a fortune.”
Wonderful.
What happens if it reaches $52 instead?
Or $45?
Or opens tomorrow at $37 because the company announced something unpleasant while everyone was asleep?
Risk planning begins by asking what evidence would show that the original setup no longer deserves confidence.
2. Entry is the reference point
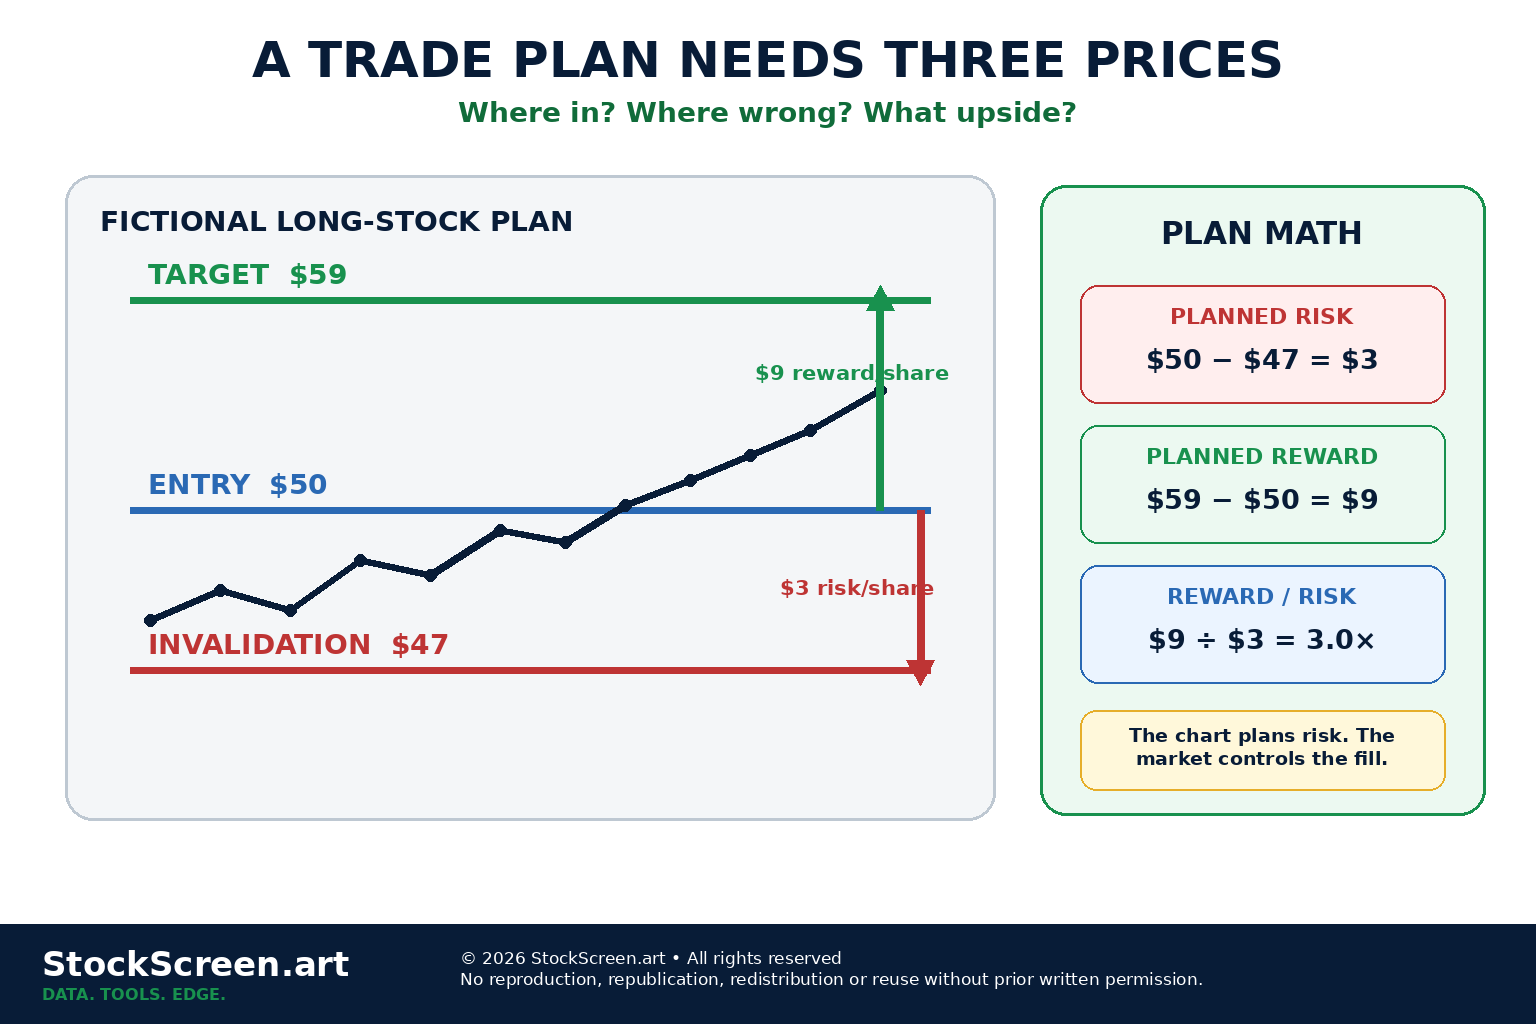
The entry is the price at which the hypothetical position is established.
It matters because planned risk and planned reward are measured from that reference point.
If the planned entry is $50, a $47 invalidation level creates a different risk profile than a $42 invalidation level.
Same stock.
Same opinion.
Very different downside distance.
3. Invalidation is an analytical idea
An invalidation level is the point where your original thesis should be reconsidered.
It may be based on:
- a failed breakout;
- a loss of support;
- a trend violation;
- a volatility threshold;
- new fundamental information;
- another condition that directly contradicts the setup.
Invalidation answers:
“At what point does the evidence no longer support the idea I entered for?”
4. An invalidation level is not the same thing as a stop order
This distinction matters.
An invalidation level is part of the analysis.
A stop order is an order instruction sent to a broker.
Investor.gov explains that when a stop price is reached, a stop order becomes a market order. The eventual execution price can therefore differ materially from the stop price in a fast-moving market.
5. Planned per-share risk
For a simple long-stock example:
Planned Per-Share Risk = Entry Price − Invalidation Price
Suppose:
- entry = $50;
- invalidation = $47.
Planned per-share risk is:
$50 − $47 = $3 per share
This is a planning number.
It is not a guarantee that the realized loss will stop at exactly $3.
6. Planned reward
Now suppose the analysis identifies a reasonable objective at $59.
Planned reward is:
Planned Reward = Target − Entry
So:
$59 − $50 = $9 per share
Again, the word planned is doing important work.
A target is an analytical objective, not a contractual obligation imposed on the market.
7. Reward-to-risk ratio
Using the example above:
- planned reward = $9;
- planned risk = $3.
Reward-to-risk is:
Reward / Risk = 9 / 3 = 3.0×
You may also hear this described as “three to one.”
The point is simple:
the planned upside is three times the planned downside distance.
8. A 3:1 setup is not automatically a good trade
This is one of the most important cautions in the lesson.
Suppose someone offers you a trade with:
- $3 planned risk;
- $9 planned reward.
That sounds attractive.
But what if the target has almost no realistic chance of being reached?
A reward/risk ratio says nothing by itself about probability.
9. Probability and payoff interact
A strategy can sometimes succeed with a lower win rate if winners are much larger than losers.
Another strategy may require a higher win rate because winners and losers are similar in size.
This relationship leads to the concept of expectancy.
In simplified form:
Expected Outcome ≈ (Win Rate × Average Win) − (Loss Rate × Average Loss)
That equation becomes useful only when the inputs come from credible evidence rather than optimism wearing a spreadsheet.
10. Historical win rates can mislead
A backtest can exaggerate expected performance when it contains:
- look-ahead bias;
- survivorship bias;
- unrealistic fills;
- ignored transaction costs;
- overfit rules;
- too few observations.
A reward/risk plan should therefore not be combined casually with a historical win rate and presented as certainty.
11. Position size converts chart risk into dollar risk
Suppose the fictional trade risks $3 per share.
Buying 10 shares creates approximately $30 of planned price risk.
Buying 1,000 shares creates approximately $3,000.
The chart did not change.
The financial exposure did.
12. A simple educational sizing formula
A commonly useful teaching relationship is:
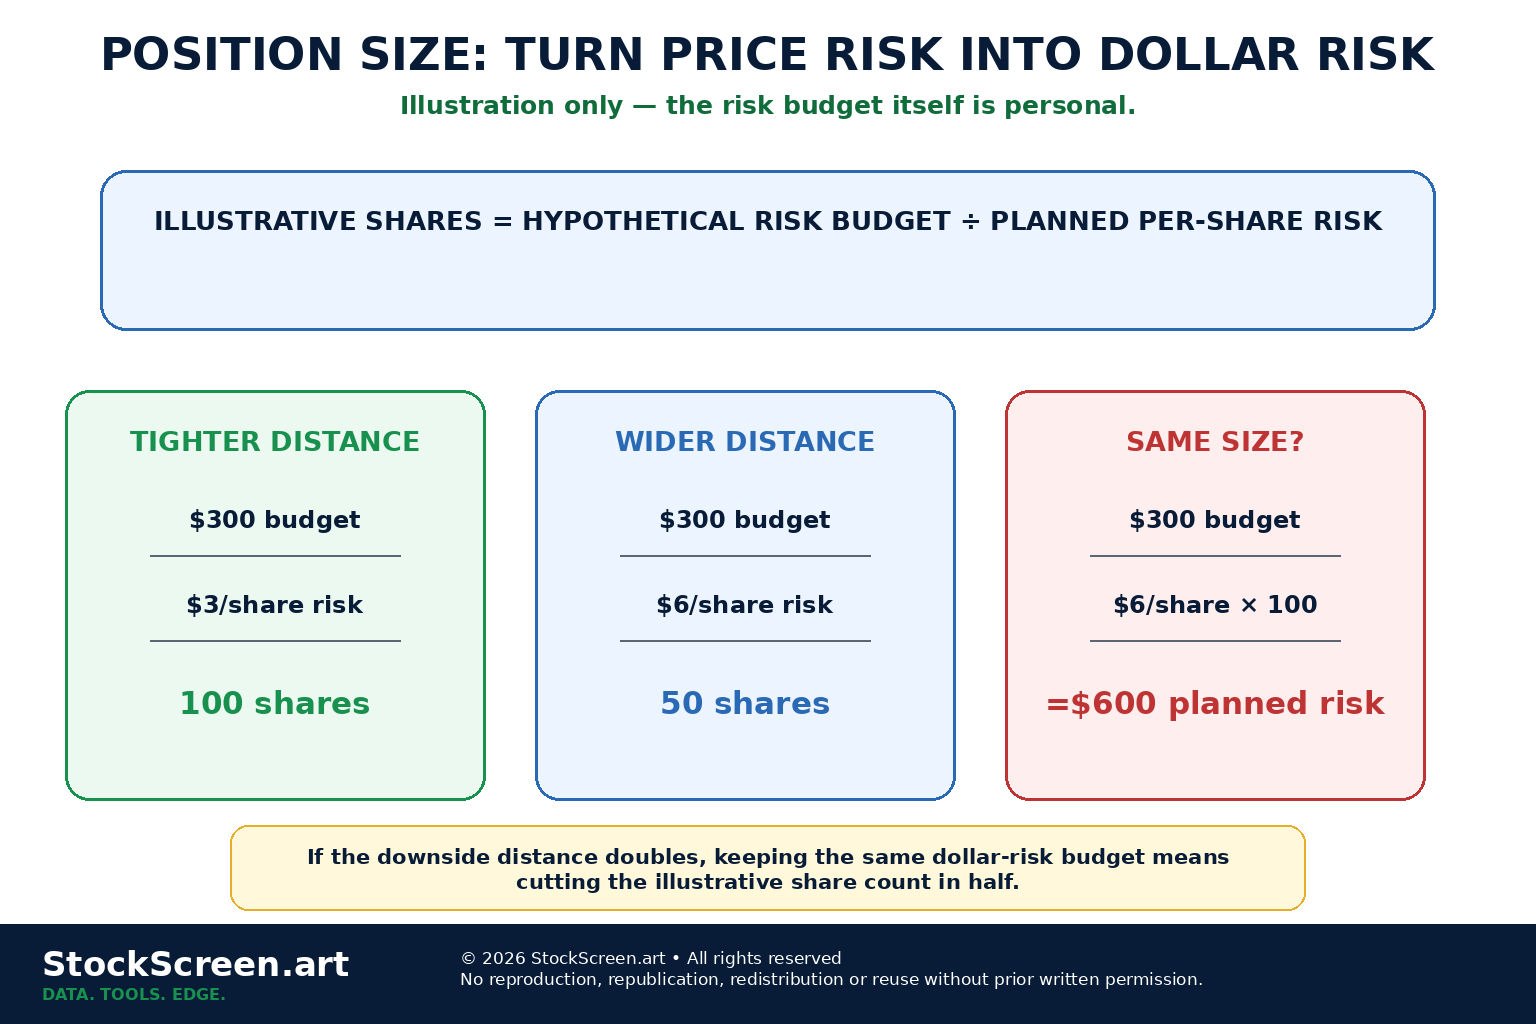
Illustrative Shares = Hypothetical Risk Budget / Planned Per-Share Risk
Suppose, purely for illustration:
- a hypothetical risk budget is $250;
- planned per-share risk is $2.50.
Then:
$250 / $2.50 = 100 shares
This formula does not tell you what your personal risk budget should be.
That depends on your financial situation, objectives, risk tolerance, horizon, account structure and broader portfolio.
13. Wider invalidation means smaller size when risk budget stays fixed
Imagine two versions of the same hypothetical trade.
Plan A
- risk budget = $300;
- risk per share = $3;
- illustrative size = 100 shares.
Plan B
- risk budget = $300;
- risk per share = $6;
- illustrative size = 50 shares.
The second trade gives price twice as much room.
To preserve the same planned dollar risk, the position is half as large.
14. Do not choose the stop after choosing the size
A common backwards workflow is:
- decide how many shares you want;
- calculate how much loss feels tolerable;
- place the invalidation level exactly there.
That lets the desired position size determine the technical thesis.
A more coherent sequence is:
- identify the setup;
- define where the setup becomes invalid;
- measure the risk distance;
- then determine whether the resulting position size and total exposure are acceptable.
15. Volatility changes the amount of room a stock may need
Some stocks regularly move 1% in a day.
Others can move 8% before lunch and still consider it a relatively calm Tuesday.
An invalidation distance that is sensible for one security may be meaningless for another.
Volatility measures such as ATR can provide context for ordinary price movement.
They should not automatically dictate a stop, but they can help answer whether a planned level is sitting inside routine noise.
16. Support and structure can help define invalidation
If a breakout thesis depends on price holding above a prior resistance area, a decisive move back through that area may weaken the setup.
If a trend thesis depends on a sequence of higher lows, breaking that structure may matter.
The principle is:
The invalidation level should be connected to the reason for the trade.
17. Targets should also have a reason
A target can come from:
- prior resistance;
- a measured technical objective;
- a valuation estimate;
- a volatility-based framework;
- another evidence-based method.
“I want a 4:1 ratio, therefore the target is exactly four times farther away” is not analysis by itself.
The target should be plausible first.
Then the ratio can tell you whether the resulting trade geometry is attractive enough to investigate further.
18. Sometimes the correct answer is no trade
Suppose:
- a logical invalidation is far away;
- a realistic target is close;
- liquidity is poor;
- earnings are tomorrow morning.
You do not have to force the trade to fit the template.
A planning framework is allowed to conclude:
“Interesting stock. Unattractive setup right now.”
19. Gap risk can overwhelm a planned stop
Stocks do not promise to trade continuously through every price.
News can arrive when the market is closed.
A stock might close at $50 and open at $42.
If your planned invalidation was $47, there may be no opportunity to transact near $47.
This is one reason planned risk and realized risk are different concepts.
20. Stop orders have execution risk
Investor.gov notes that a stop price is a trigger, not a guaranteed execution price.
Once triggered, a standard stop order becomes a market order.
In a fast market, the actual fill can be meaningfully worse than the stop price.
21. Stop-limit orders solve one problem and create another
A stop-limit order adds a limit price.
That can prevent execution below a chosen limit for a sell order.
But the protection comes with another risk:
the order may not execute at all if the market moves through the limit price.
22. Liquidity belongs in the plan
A theoretical position size may be inappropriate in a thinly traded stock.
Larger orders can:
- cross a wide spread;
- move through multiple price levels;
- be difficult to exit quickly;
- produce slippage not captured by a simple risk formula.
Position planning must therefore respect the market's ability to absorb the position.
23. Event risk deserves special attention
Earnings announcements, regulatory decisions, trial results, court rulings and major economic events can produce discontinuous price moves.
If a known event is approaching, the risk profile can change dramatically even if the chart looks unchanged five minutes before the announcement.
24. Concentration can make a reasonable position unreasonable
A position does not live alone.
Five stocks from the same industry may behave like one large economic exposure.
Investor.gov and FINRA both emphasize diversification as a way of managing portfolio risk.
We will explore concentration and portfolio interactions in much greater depth in the Portfolio & Risk module.
25. Risk tolerance is personal
Investor.gov defines risk tolerance in terms of an investor's ability and willingness to lose some or all of an original investment in exchange for potentially greater returns.
That is why this lesson does not prescribe a universal “risk X% per trade” rule.
A number that is sensible in one financial situation can be reckless in another.
26. Do not widen the invalidation just because price is approaching it
Imagine the original plan says:
“Below $47, the breakout thesis is invalid.”
Price reaches $47.20.
Suddenly the plan becomes:
“Actually, I have always been a long-term investor.”
That is not analysis.
That is moving the goalposts while standing on them.
If new evidence genuinely changes the thesis, reassess explicitly.
Do not rewrite the thesis merely to avoid admitting the old one failed.
27. A target can move too—but only for a reason
Markets reveal new information.
A trade plan does not need to be frozen forever.
But changes should be linked to evidence:
- new support or resistance;
- new fundamental information;
- volatility changes;
- trend acceleration or deterioration;
- other documented conditions.
“It went up, therefore my target is now the Moon” is not a documented condition.
28. R-multiples can standardize outcomes
Some traders describe results in units of initial planned risk, often called R.
If the initial planned risk was $200:
- a $200 loss = −1R;
- a $400 gain = +2R;
- a $100 gain = +0.5R.
This can help compare trades with different prices and share counts.
It remains a bookkeeping convention, not a guarantee that losses cannot exceed −1R.
29. Record the plan before the outcome
A journal is most useful when the plan is written before the result is known.
Useful fields can include:
- setup date;
- entry condition;
- invalidation condition;
- target or objective;
- planned risk;
- position size;
- event risks;
- reason for any later change.
Otherwise hindsight has an amazing ability to remember that your plan was exactly what the market eventually did.
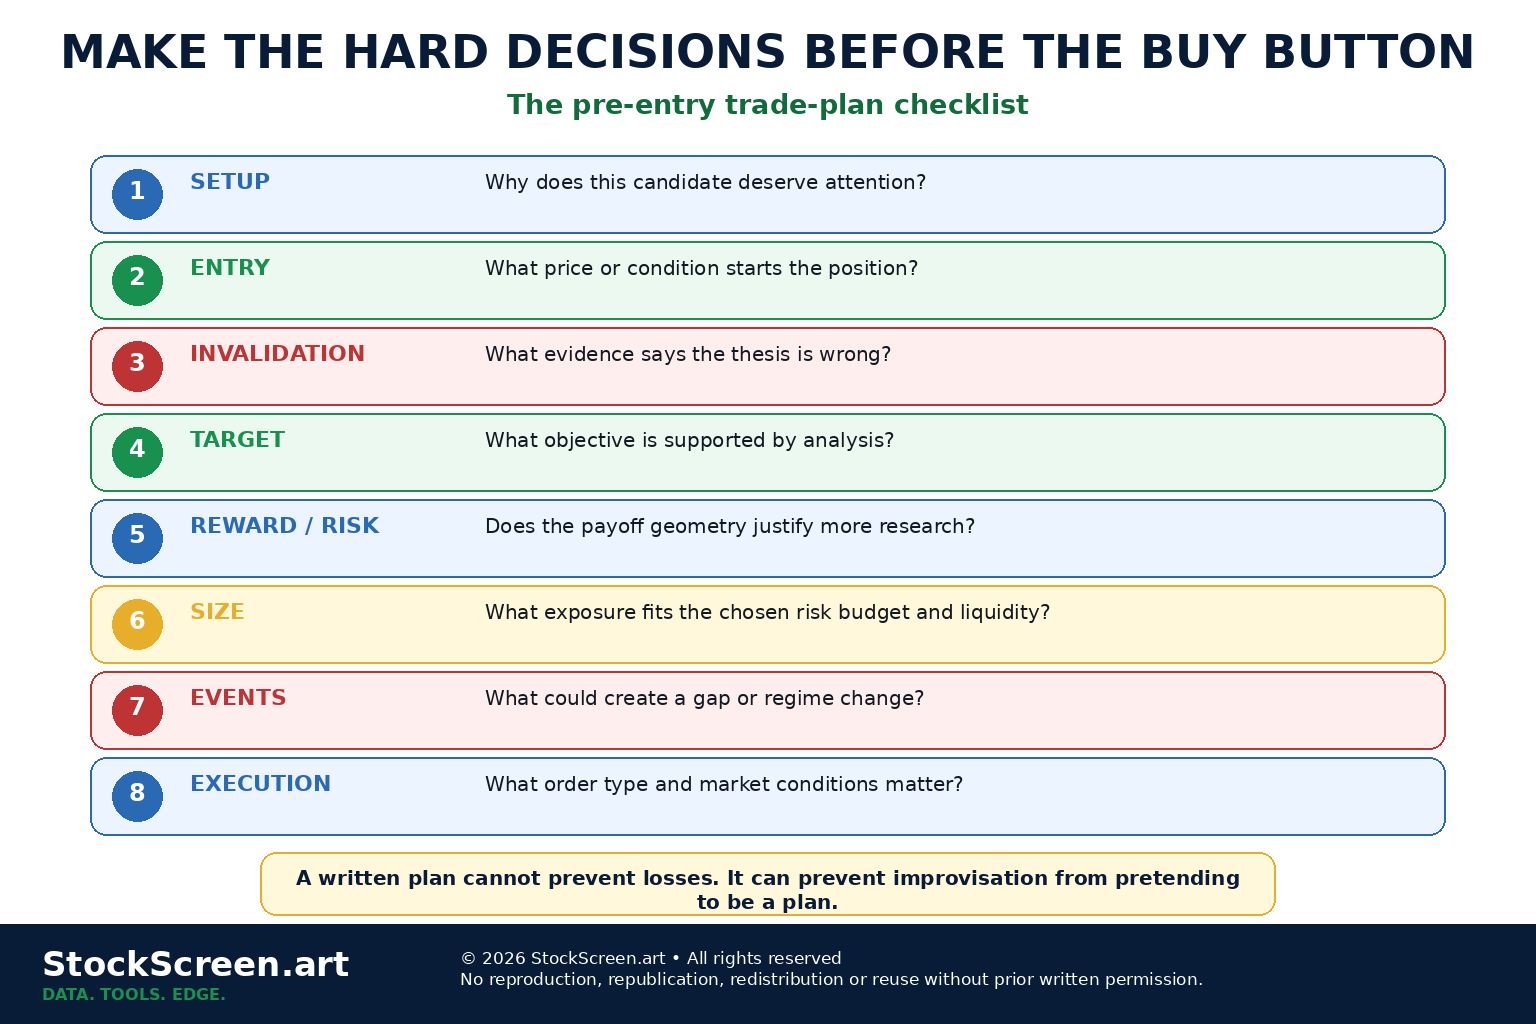
30. A practical pre-entry checklist
- Setup: Why does this candidate deserve attention?
- Entry: What price or condition starts the position?
- Invalidation: What evidence says the thesis is wrong?
- Target: What objective is supported by the analysis?
- Reward/Risk: Is the geometry attractive enough?
- Size: What exposure fits the chosen hypothetical risk budget and liquidity?
- Events: What could create a gap or regime change?
- Execution: What order type and trading conditions matter?
- Review: What would justify changing the plan?
31. How this completes the Stock Analysis & Screening module
We can now connect the entire module.
- Screening: reduce thousands of securities to a focused candidate list.
- Relative strength: identify who is leading versus relevant benchmarks or peers.
- Volume and confirmation: ask whether participation supports the price move.
- Risk/reward: define what the setup offers relative to its downside.
- Position planning: translate chart structure into controlled exposure and explicit decisions.
Notice what the process still does not say:
“This stock is guaranteed to work.”
The process is designed to make uncertainty more manageable, not to pretend uncertainty retired.
32. Nine mental models worth keeping
- Define where you are wrong before deciding how much you might make.
- Invalidation is analysis; a stop order is execution.
- Reward/risk measures payoff geometry, not probability.
- Position size converts price risk into account-level exposure.
- Wider risk distance requires smaller size if the dollar risk budget is unchanged.
- Planned loss and realized loss can differ because of gaps, slippage and liquidity.
- A target needs analytical support, not just an attractive ratio.
- A good plan is written before emotion has a position to defend.
- Sometimes the highest-quality risk decision is to pass.
Quick knowledge check
Ten questions. No leverage yet. Your calculator may relax for approximately twelve minutes.
1. What is an invalidation level?
A price or condition that materially weakens or contradicts the original investment or trading thesis.
2. Is an invalidation level the same as a guaranteed stop execution price?
No. Invalidation is an analytical concept. A stop order is an execution instruction, and its fill can differ from the stop price.
3. If entry is $50 and invalidation is $47, what is planned per-share risk?
$3 per share.
4. If entry is $50 and target is $59, what is planned reward?
$9 per share.
5. Using the same example, what is planned reward/risk?
3.0×, because $9 planned reward divided by $3 planned risk equals 3.
6. Does a 3:1 reward/risk ratio mean a high probability of profit?
No. Reward/risk describes payoff geometry; probability must be estimated separately and can be uncertain.
7. If a hypothetical risk budget is $300 and risk per share is $6, what illustrative size results?
50 shares, before considering liquidity, concentration, execution constraints or personal suitability.
8. Why can realized loss exceed planned loss?
Gaps, slippage, poor liquidity and fast-moving markets can cause execution away from the planned level.
9. What is one danger of a stop-limit order?
The limit may prevent execution if the market moves through the specified price.
10. What is the purpose of a pre-entry plan?
To define the setup, entry, invalidation, target, exposure and relevant risks before the position introduces emotional pressure.
Where we go next
You have completed the Foundation Path's Stock Analysis & Screening module.
Next we enter a different world:
Derivatives & Leverage.
The first lesson is the existing Foundation lesson:
FND-DER-01 — Options, Leverage & a Good Stock Idea.
Because once you understand how to plan risk in a stock, the next useful question is what happens when a contract starts multiplying the consequences.
Primary sources & further reading
- Investor.gov — Asset Allocation and Diversification
- Investor.gov — Stop, Stop-Limit, and Trailing Stop Orders
- Investor.gov — Understanding Order Types
- FINRA — Asset Allocation and Diversification
- FINRA — Stocks