Investors love shortcuts.
Not because investors are lazy.
Well, not only because investors are lazy.
A public company can have hundreds of pages of filings, years of financial history, several business segments, a complicated capital structure and management guidance written in a dialect known technically as “optimistic conditional future tense.”
Valuation multiples compress some of that complexity into a ratio.
“How much is the market asking me to pay relative to some financial measure of the company?”
The important phrase is some financial measure.
Change the denominator and you change the question.
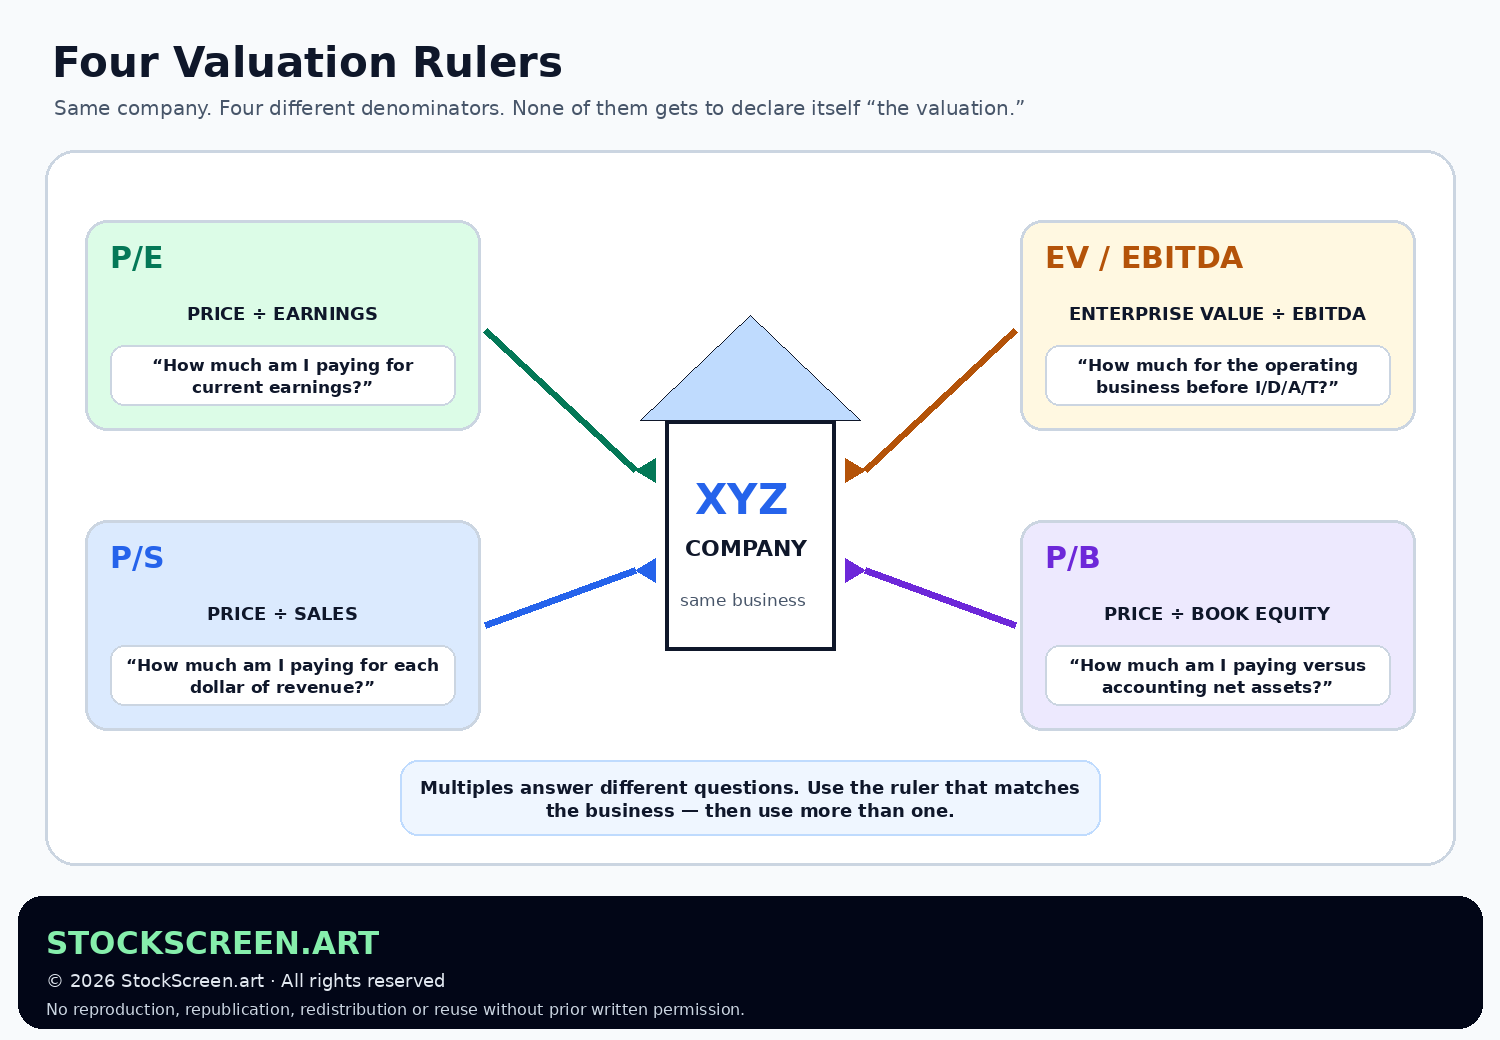
1. What is a valuation multiple?
A multiple usually takes some measure of market value and divides it by a financial measure.
Examples:
- Stock price ÷ earnings per share
- Market capitalization ÷ revenue
- Enterprise value ÷ EBITDA
- Market capitalization ÷ shareholders’ equity
If the result is 10×, the market is valuing the relevant numerator at ten times the denominator.
The ratio becomes useful when you compare it with:
- similar companies;
- the same company’s historical valuation;
- its growth, margins and financial quality;
- the interest-rate and economic environment;
- what you believe the future denominator may become.
2. P/E: price relative to earnings
Investor.gov describes the price-to-earnings ratio, or P/E, as a way of gauging whether a stock price is high or low compared with the past or with other companies.
The basic per-share formula is:
P/E = Current Share Price ÷ Earnings Per Share
Suppose fictional QualityWidget trades at $60 per share and earned $4 per share during the past twelve months.
$60 ÷ $4 = 15× P/E
In very loose plain English:
“The market price is fifteen times the company’s current annual earnings per share.”
It does not mean you literally receive your money back in fifteen years.
Earnings can grow, shrink, disappear, be reinvested, be distributed, or be affected by accounting items.
3. Trailing P/E vs. forward P/E
A trailing P/E uses historical earnings, commonly the latest twelve months.
A forward P/E uses expected future earnings.
Forward P/E can be useful because investing is about the future.
Forward P/E can also be dangerous because the future has declined every invitation to provide audited statements in advance.
Analyst estimates change.
Company guidance changes.
Economic conditions change.
Forward P/E uses earnings somebody expects.
4. What does a high P/E mean?
A high P/E can mean investors expect:
- strong future growth;
- high-quality, durable earnings;
- excellent margins;
- low business risk;
- valuable reinvestment opportunities;
- or simply that enthusiasm has become expensive.
A high P/E is not automatically overvaluation.
It means the market is paying a relatively high price for the current earnings base.
5. What does a low P/E mean?
A low P/E might mean:
- the stock is undervalued;
- earnings are expected to decline;
- the company has excessive debt;
- the business is cyclical and earnings are near a peak;
- the company faces legal, competitive or structural risk;
- investors simply dislike it.
The multiple tells you the market price is low relative to the denominator.
It does not tell you whether the denominator is durable.
6. Negative earnings and P/E
If earnings are negative, an ordinary positive P/E interpretation stops working.
Mathematically you can divide price by a negative EPS.
Analytically the resulting negative multiple usually does not mean:
“Wonderful. This is even cheaper than zero.”
Investors generally treat P/E as not meaningful for a loss-making company and turn to other measures while investigating whether profitability is achievable.
7. P/S: price relative to sales
The price-to-sales ratio, or P/S, compares common-equity market value with revenue.
It can be calculated as:
P/S = Market Capitalization ÷ Revenue
or equivalently on a per-share basis using sales per share.
Suppose:
- Market cap = $2B
- Annual revenue = $1B
P/S = $2B ÷ $1B = 2×
8. Why P/S can help when earnings are negative
A young company may have meaningful revenue but little or no current profit because it is spending heavily on:
- sales;
- research;
- new markets;
- infrastructure;
- customer acquisition.
In that situation, P/E may be unusable while P/S remains calculable.
That does not make P/S magically better.
It simply gives you a different ruler.
9. The giant problem with P/S: one dollar of sales is not one dollar of value
Consider:
| Company A | Company B | |
|---|---|---|
| Revenue | $1B | $1B |
| Gross margin | 80% | 15% |
| Operating margin | 25% | 2% |
| P/S | 5× | 1× |
Company B looks much “cheaper” on sales.
But Company A converts far more of each revenue dollar into gross and operating profit.
Revenue without margins is like being told a restaurant served 10,000 meals without being told whether each meal made $20 or lost $4 and a fork.
10. Market capitalization: value of the common equity
Before EV/EBITDA, we need to distinguish two numerators.
Market capitalization is approximately:
Share price × common shares outstanding
It represents the market value of the company’s common equity.
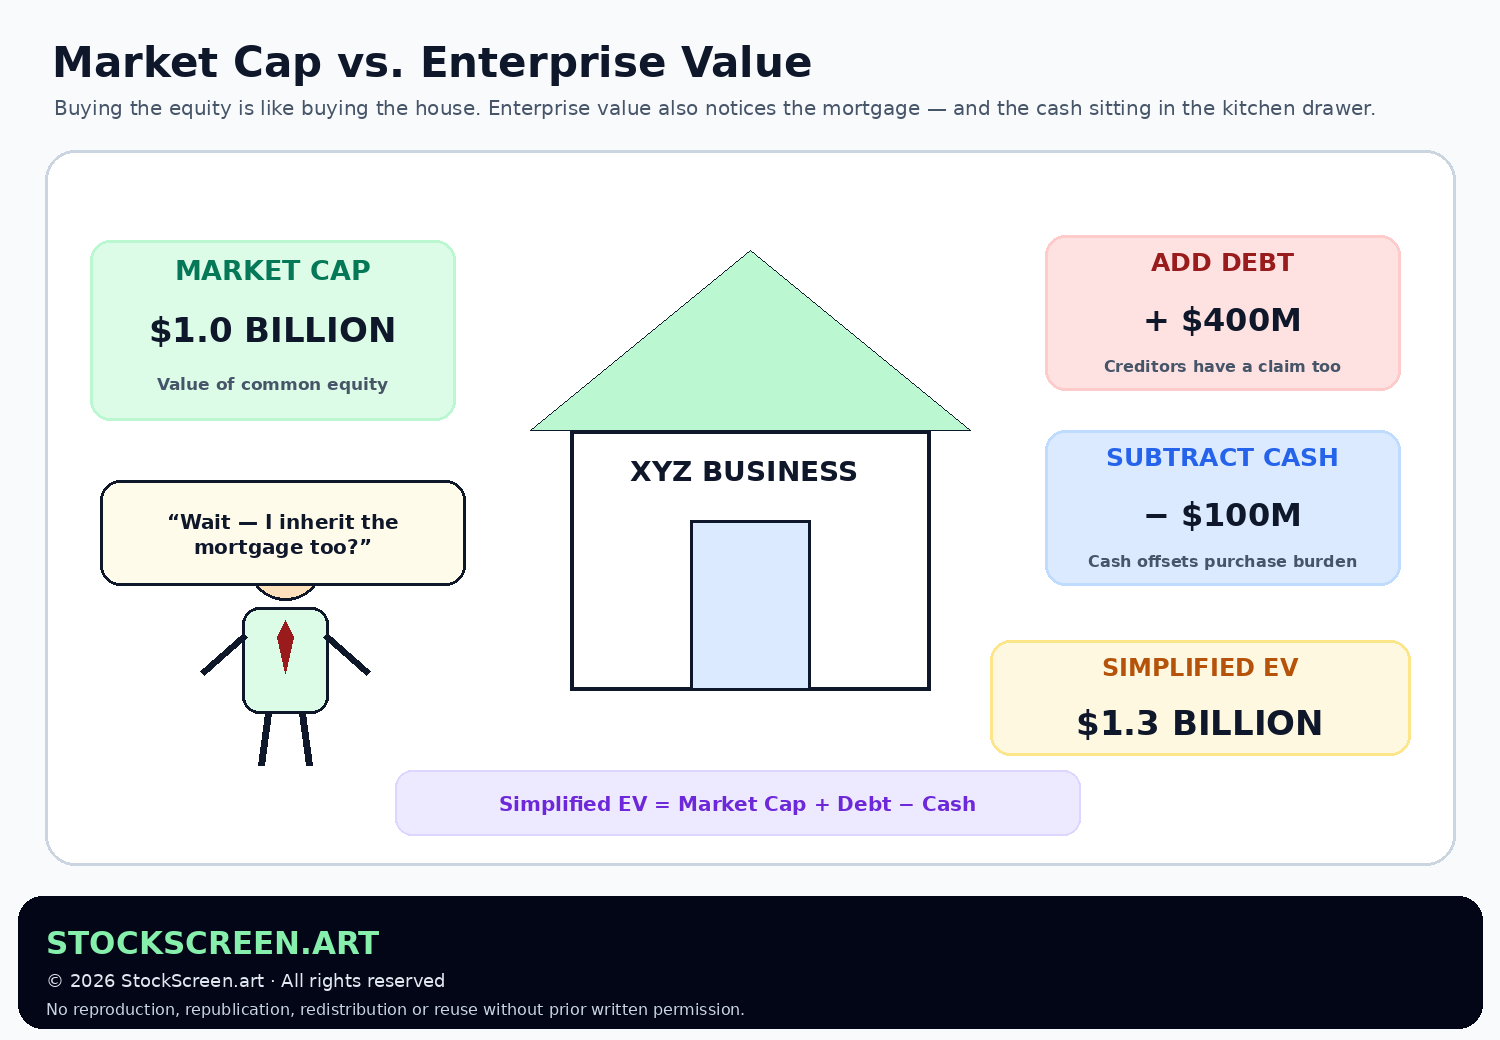
If XYZ has:
- 100M shares outstanding;
- a $10 share price;
market capitalization is about:
$1B
But common shareholders are not the only capital providers.
Creditors have claims too.
11. Enterprise value: thinking about the whole operating business
Enterprise value, or EV, attempts to measure the value of the operating enterprise across its capital providers rather than only the common equity.
A simplified educational bridge is:
EV ≈ Market Cap + Debt − Cash
Professional calculations may also adjust for items such as preferred stock, noncontrolling interests, leases, investments or other non-operating assets and liabilities, depending on the purpose and methodology.
Why add debt?
Because someone acquiring the whole business must consider creditor claims.
Why subtract cash?
Because excess cash is an asset available to offset some of the effective purchase burden.
12. EBITDA: what is the denominator?
EBITDA stands for:
Earnings Before Interest, Taxes, Depreciation and Amortization
The SEC treats EBITDA as a non-GAAP financial measure when presented outside the specific GAAP context and provides rules and guidance for non-GAAP disclosure.
EBITDA attempts to look at operating earnings before:
- capital-structure effects from interest;
- income taxes;
- depreciation;
- amortization.
This can make comparisons easier across companies with different financing structures or depreciation profiles.
13. EV/EBITDA
The basic ratio is:
EV/EBITDA = Enterprise Value ÷ EBITDA
Suppose:
- Enterprise value = $5B
- EBITDA = $500M
EV/EBITDA = 10×
Notice the numerator and denominator are conceptually matched:
- EV relates to all capital providers;
- EBITDA is measured before interest paid to creditors.
This matching is one reason EV/EBITDA is widely used in corporate and comparative valuation.
14. Why not Market Cap / EBITDA?
Market capitalization belongs to common shareholders.
EBITDA is measured before interest expense and therefore before the earnings stream is split between debt and equity claimants.
Mixing them can create a numerator-denominator mismatch.
Enterprise-value numerator → pre-financing operating denominator.
15. EBITDA is useful — and very much not cash flow
EBITDA adds back depreciation and amortization.
That can help compare operating performance.
It can also make capital-intensive companies look rather charming.
A factory's depreciation is non-cash in the current period.
The factory itself was not free.
Machinery wears out.
Servers need replacing.
Stores need refreshing.
This is why EBITDA should not be casually treated as free cash flow.
Lesson VAL-03 exists largely to prevent exactly that crime.
16. Adjusted EBITDA requires even more attention
Companies may also report Adjusted EBITDA.
Adjustments can exclude:
- restructuring charges;
- acquisition costs;
- stock-based compensation;
- legal charges;
- other items management considers unusual or non-core.
Some adjustments are informative.
Some recurring “one-time” expenses develop surprisingly long careers.
SEC non-GAAP guidance is one reason investors should read the reconciliation rather than accept the headline number as naturally occurring in the wild.
17. EV/EBITDA is not ideal for every industry
Enterprise-value multiples can be less intuitive for financial institutions such as banks, where debt and interest are closely tied to the operating business itself rather than functioning merely as financing choices.
Industry structure matters.
A ratio useful for an industrial manufacturer does not automatically become useful for a bank because the spreadsheet already has the column.
18. Price-to-Book: price relative to accounting equity
Price-to-book, or P/B, compares the market value of common equity with the accounting book value of shareholders’ equity.
It can be expressed as:
P/B = Market Capitalization ÷ Common Shareholders’ Equity
or:
Share Price ÷ Book Value Per Share
If:
- Market cap = $2B
- Book equity = $1B
P/B is:
2×
19. Why P/B can matter
P/B can be useful where balance-sheet assets and liabilities are economically central to the business.
Banks are a common example because financial assets, liabilities and equity capital are fundamental to how the business operates.
P/B can also be relevant for certain asset-heavy companies.
But the quality of the book value matters.
20. Book value is accounting value, not liquidation value
Recall VAL-02:
assets can include cash, receivables, inventory, property, goodwill and other items.
Their accounting carrying values do not necessarily equal:
- current market value;
- replacement cost;
- liquidation value;
- intrinsic economic value.
A company trading below book value is not automatically a bag of $1 assets being sold for 70 cents.
Some of the assets may deserve a markdown.
Some liabilities may be understated economically.
Some business value may not appear on the balance sheet at all.
21. Why P/B can be weak for intangible-heavy businesses
Imagine a software company whose economic strengths include:
- internally developed code;
- a powerful brand;
- network effects;
- customer relationships;
- employee know-how.
Much of that value may not appear as recognized book equity in the same way a factory or cash balance does.
A very high P/B can therefore be normal for some excellent asset-light businesses.
This does not prove the stock is fairly valued.
It means book value may be the wrong ruler.
22. Negative book equity
If common shareholders’ equity is negative, an ordinary positive P/B interpretation breaks down.
As we discussed in VAL-02, negative equity can result from:
- accumulated losses;
- large buybacks;
- write-downs;
- high leverage;
- other accounting and capital-allocation history.
A negative denominator is a signal to investigate, not a request to admire the multiple.
23. Same company, four very different answers
Suppose fictional XYZ has:
- Market cap: $4B
- Debt: $1B
- Cash: $500M
- Revenue: $2B
- Net income: $200M
- EBITDA: $500M
- Book equity: $1.6B
Simplified enterprise value:
$4B + $1B − $0.5B = $4.5B
| Multiple | Calculation | Result | Question |
|---|---|---|---|
| P/E | $4B ÷ $200M | 20× | Price relative to earnings |
| P/S | $4B ÷ $2B | 2× | Price relative to revenue |
| EV/EBITDA | $4.5B ÷ $500M | 9× | Enterprise value relative to EBITDA |
| P/B | $4B ÷ $1.6B | 2.5× | Equity value relative to accounting equity |
None is “more correct” in isolation.
They are answering different questions.
24. Compare apples with apples
A multiple becomes more useful when the comparison set makes economic sense.
Comparing:
- a regulated bank with a software company;
- a grocery retailer with a biotech firm;
- a mature utility with a fast-growing cloud company;
may produce a fascinating spreadsheet and a terrible conclusion.
Industries differ in:
- margin structure;
- capital intensity;
- growth rates;
- balance-sheet needs;
- cyclicality;
- business risk.
Compare similar economics whenever possible.
25. Historical multiples are useful — with context
If a company historically traded between 20× and 30× earnings and now trades at 12×, that deserves attention.
But do not stop at:
“It is below its five-year average, therefore cheap.”
Ask whether:
- growth slowed;
- margins changed;
- competition strengthened;
- interest rates changed;
- the balance sheet deteriorated;
- the old valuation was simply too high.
History is context, not a gravitational law.
26. The cyclical P/E trap
Cyclical companies can look cheapest at exactly the wrong time.
Imagine a commodity producer at the top of a pricing cycle:
- commodity prices are unusually high;
- earnings temporarily surge;
- the share price rises, but not as fast as earnings;
- P/E falls to 5×.
It looks extraordinarily cheap.
Then commodity prices normalize, earnings collapse, and the “cheap” denominator disappears.
27. The value-trap problem
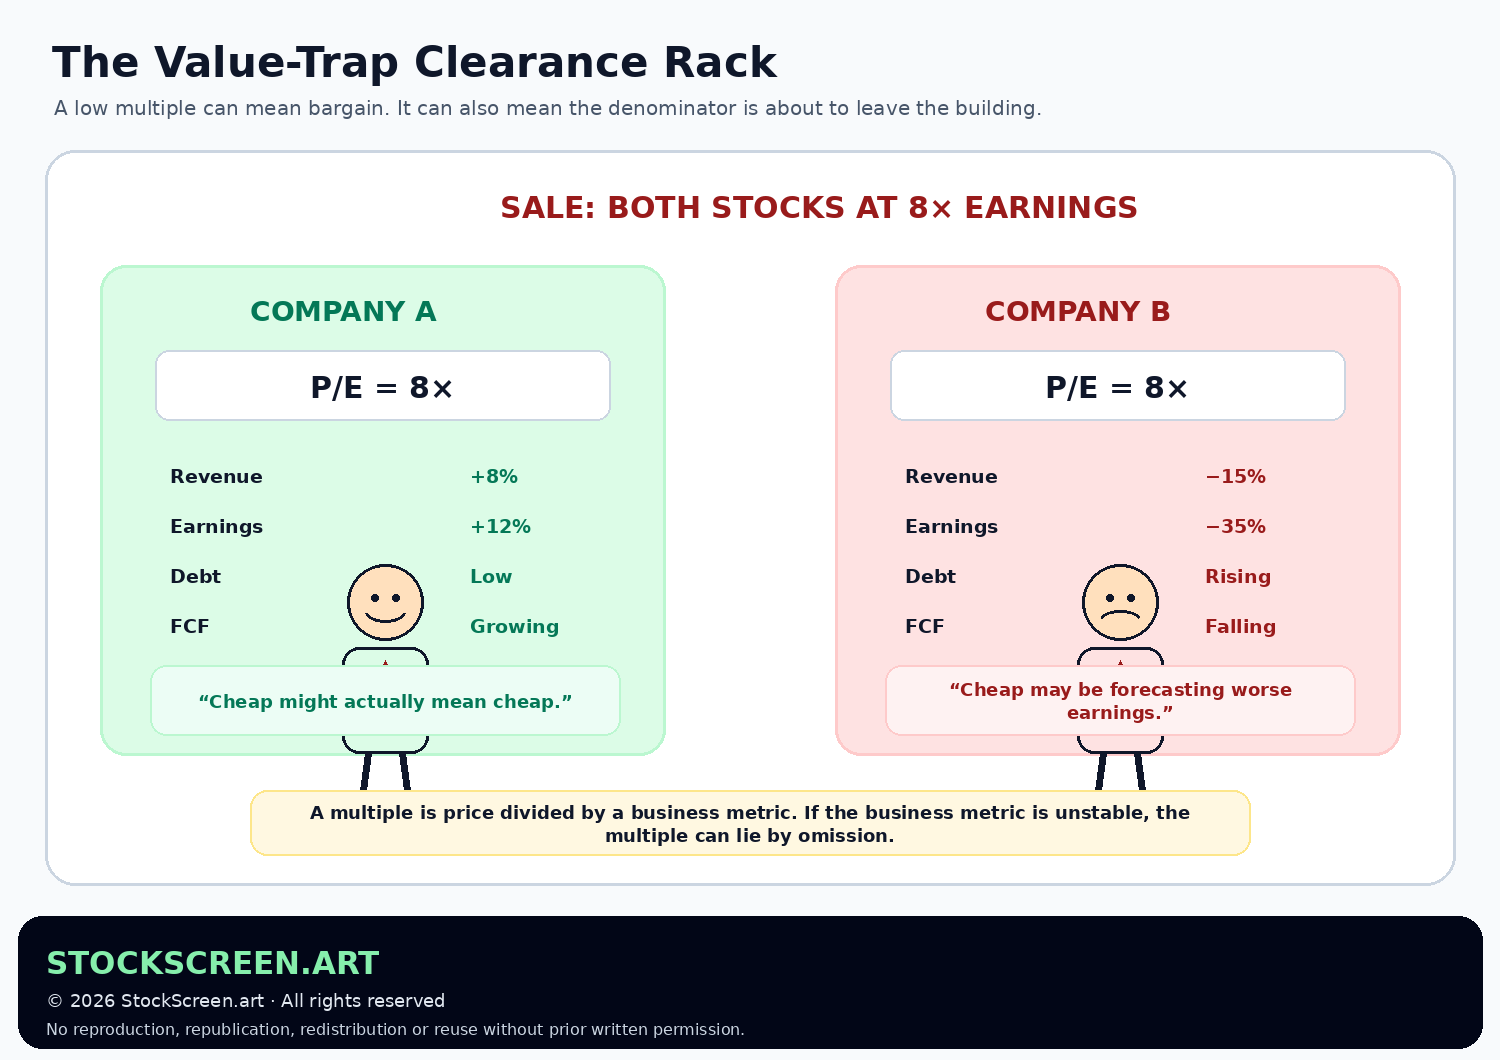
A value trap is a stock that appears cheap by conventional valuation measures but remains cheap — or becomes much cheaper — because the business deteriorates.
Imagine two companies both trading at 8× earnings.
Company A:
- revenue +8%;
- earnings +12%;
- low debt;
- growing FCF.
Company B:
- revenue −15%;
- earnings −35%;
- rising debt;
- falling FCF.
28. Growth can justify a higher multiple — but not any multiple
Suppose:
- Company A grows earnings 3% annually and trades at 10×.
- Company B grows earnings 25% annually and trades at 30×.
Company B is more expensive relative to current earnings.
But if it can sustain high growth for long enough, future earnings can rapidly change the denominator.
The analytical question is not:
“Which P/E is lower?”
It is:
“What growth, quality and durability are embedded in the price?”
29. Quality deserves a multiple too — just not a formula
Two companies with identical growth can deserve different valuations if one has:
- higher margins;
- more recurring revenue;
- better returns on capital;
- less debt;
- stronger competitive advantages;
- better cash conversion.
Multiples compress financial data.
They do not automatically price business quality correctly.
30. A practical multiple-selection guide
| Multiple | Often useful when... | Major caution |
|---|---|---|
| P/E | Earnings are positive and reasonably representative | Earnings can be cyclical, distorted or negative |
| P/S | Revenue is meaningful but current earnings are weak or negative | Ignores margins and cost structure |
| EV/EBITDA | Comparing operating companies with differing capital structures | EBITDA is non-GAAP and ignores capital spending and other real costs |
| P/B | Accounting equity is economically meaningful, often in some financial or asset-heavy businesses | Book value may poorly capture intangible-heavy businesses or current asset values |
31. A valuation-multiple checklist
- What exactly is the numerator? Equity value or enterprise value?
- What exactly is the denominator? Historical, estimated, GAAP or adjusted?
- Is the denominator positive and economically meaningful?
- Are the comparison companies genuinely similar?
- Are growth rates and margins comparable?
- Is leverage materially different?
- Is the business cyclical?
- Is the multiple below history because the company changed?
- What does cash flow say?
- What assumption about the future would make today's price sensible?
32. Why this matters for StockScreen.art
StockScreen.art can identify stocks showing favorable market evidence: trend, momentum, relative strength, liquidity and risk/reward.
Valuation asks a different question:
“What price am I being asked to pay for the business economics underneath that setup?”
A strong technical candidate might also be:
- cheap relative to durable earnings;
- fairly valued for high-quality growth;
- expensive but becoming more profitable quickly;
- a momentum stock whose valuation already assumes perfection.
The chart and the multiple are not rivals.
They are different evidence.
33. Nine mental models worth keeping
- A multiple is a ruler, not a verdict.
- P/E needs meaningful earnings.
- P/S ignores profitability.
- EV and market cap are different because capital structure matters.
- EBITDA is useful but is not free cash flow.
- P/B only helps when book equity is economically informative.
- Low multiples can be value traps.
- Compare like businesses with consistent definitions.
- Growth, quality, leverage and cash generation belong beside the multiple.
Quick knowledge check
Ten questions. No adjusted answers unless reconciled below.
1. A stock trades at $50 and earned $5 per share. What is its P/E?
10×.
2. Why is ordinary P/E difficult to interpret when earnings are negative?
Because the denominator is negative, so the usual concept of paying a positive multiple of current earnings no longer works meaningfully.
3. What does P/S ignore?
It ignores the profitability and cost structure behind the revenue. Two companies can have identical sales and radically different margins.
4. What is a simplified enterprise-value formula?
Market capitalization plus debt minus cash, with more complete professional calculations often making additional adjustments.
5. Why does EV/EBITDA use enterprise value rather than only market cap?
Because EBITDA is measured before interest and therefore relates to the operating earnings available before capital-structure claims are split between debt and equity.
6. Is EBITDA a standardized GAAP earnings line?
No. EBITDA is treated as a non-GAAP financial measure when presented as such, and investors should inspect definitions and reconciliations.
7. Why is EBITDA not the same as free cash flow?
Among other differences, EBITDA adds back depreciation and amortization and does not subtract capital expenditures required to maintain or grow productive assets.
8. When can P/B be more informative?
When accounting book equity is economically meaningful, such as in some financial or asset-heavy businesses.
9. If two stocks both trade at 8× earnings, are they equally cheap?
No. Their growth, balance sheets, cyclicality, cash generation, margins and durability of earnings may be completely different.
10. What is the most important rule when comparing multiples?
Use economically comparable companies and consistent definitions, then interpret the multiple alongside business quality, growth and financial risk.
Where we go next
We now have four quick ways to compare price with current business fundamentals.
Next we deal with one of investing’s most persistent false arguments:
FND-VAL-05 — Growth vs. Value.
One side says:
“I want a wonderful business that can compound.”
The other says:
“Excellent. I would also prefer not to pay the GDP of a medium-sized country for it.”
As we will discover, growth and value are not opposites nearly as often as the labels suggest.
Primary sources & further reading
- Investor.gov — Price-Earnings (P/E) Ratio
- Investor.gov — Price-Book Ratio
- U.S. Securities and Exchange Commission — Beginner's Guide to Financial Statements
- U.S. Securities and Exchange Commission — Non-GAAP Financial Measures C&DIs
- U.S. Securities and Exchange Commission — Conditions for Use of Non-GAAP Financial Measures
- Investor.gov — How to Read a 10-K