If Lesson 1 introduced the financial statements, this lesson is where we stop waving at them from across the room and actually read two of them.
Fortunately, the most important distinction can be explained without an accounting degree:
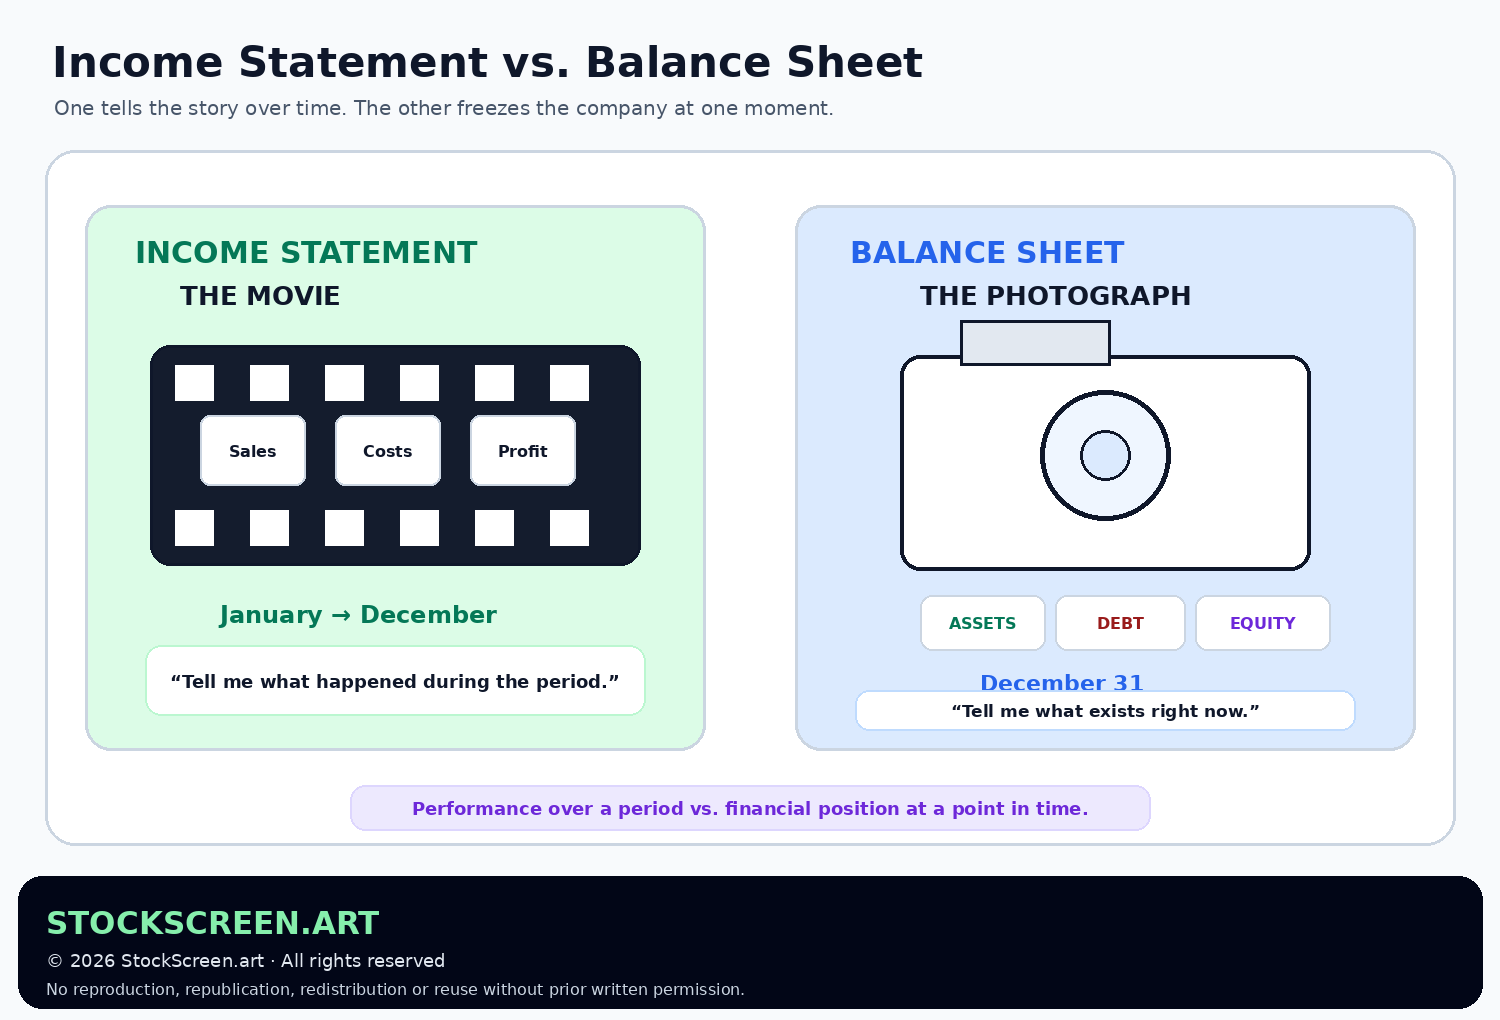
Balance sheet = the photograph. It shows what the company owns and owes at one specific moment.
One tells you about performance.
The other tells you about financial position.
Investors need both because a company can report excellent profits while carrying an uncomfortable amount of debt, or own valuable assets while producing disappointing earnings.
1. The income statement: performance over time
The SEC explains that an income statement shows how much revenue a company generated and what expenses it incurred over a period of time.
That period might be:
- three months;
- six months;
- nine months;
- a full fiscal year.
If the statement says:
Year ended December 31, 2026
it is describing activity that occurred throughout that year.
It is not merely a snapshot of December 31.
2. The income-statement staircase
The SEC describes the income statement as moving from the top line down through different categories of costs and expenses.
A simplified version might look like this:
| Line | What it means |
|---|---|
| Revenue | Sales or other operating revenue generated during the period. |
| Cost of revenue / cost of goods sold | Direct costs associated with producing the goods or services sold. |
| Gross profit | Revenue minus direct cost of revenue. |
| Operating expenses | Items such as selling, administration, research and development, depending on the company. |
| Operating income | Profit from operations after operating costs and expenses. |
| Interest / other items | Financing costs and other non-operating income or expense. |
| Income taxes | Tax expense recognized for the period. |
| Net income | The bottom-line accounting profit or loss. |
Real companies use different labels and may present additional lines.
Banks, insurers, manufacturers and software companies do not all have identical income statements, because they do not all make money the same way.
Accounting has enough complexity already. It did not also need to insist every business pretend to be a shoe factory.
3. Gross profit and operating income answer different questions
Suppose fictional company LampCo reports:
- Revenue: $100M
- Cost of goods sold: $60M
- Gross profit: $40M
- Operating expenses: $25M
- Operating income: $15M
- Interest and taxes: $5M
- Net income: $10M
Gross profit asks:
“After the direct cost of producing what we sold, how much was left?”
Operating income asks:
“After also paying the expenses required to run the business, how profitable were operations?”
Net income keeps walking down the staircase until financing, taxes and other recognized items have had their turn.
4. Margins make the staircase easier to compare
Dollar amounts matter.
Percentages often make comparisons easier.
In LampCo:
- Gross margin = $40M ÷ $100M = 40%
- Operating margin = $15M ÷ $100M = 15%
- Net margin = $10M ÷ $100M = 10%
Tracking those margins over time can show whether:
- pricing power is improving;
- production costs are rising;
- operating expenses are becoming more efficient;
- interest expense is increasing;
- profitability is scaling with revenue.
5. Earnings per share: dividing the profit pie
Public companies commonly report earnings per share, or EPS.
In simplified form:
EPS = earnings available to common shareholders ÷ weighted-average common shares
This matters because the same total profit can produce different economics per share if the number of shares changes.
If a company earns $100 million:
- with 100 million shares, that is roughly $1.00 per share;
- with 200 million shares, that is roughly $0.50 per share.
The company did not forget how to earn money.
There are simply more plates around the table.
Diluted EPS can also reflect the potential impact of certain securities that could become common shares.
We will return to per-share valuation when we reach P/E and other valuation multiples.
6. The balance sheet: a snapshot at one date
The SEC explains that a balance sheet shows what a company owns and what it owes at a fixed point in time.
A balance sheet might be dated:
December 31, 2026
That means the numbers describe the company's financial position on that date.
The next day:
- customers may pay invoices;
- the company may buy inventory;
- debt may be repaid;
- cash may move;
- new liabilities may arise.
The photograph changes.
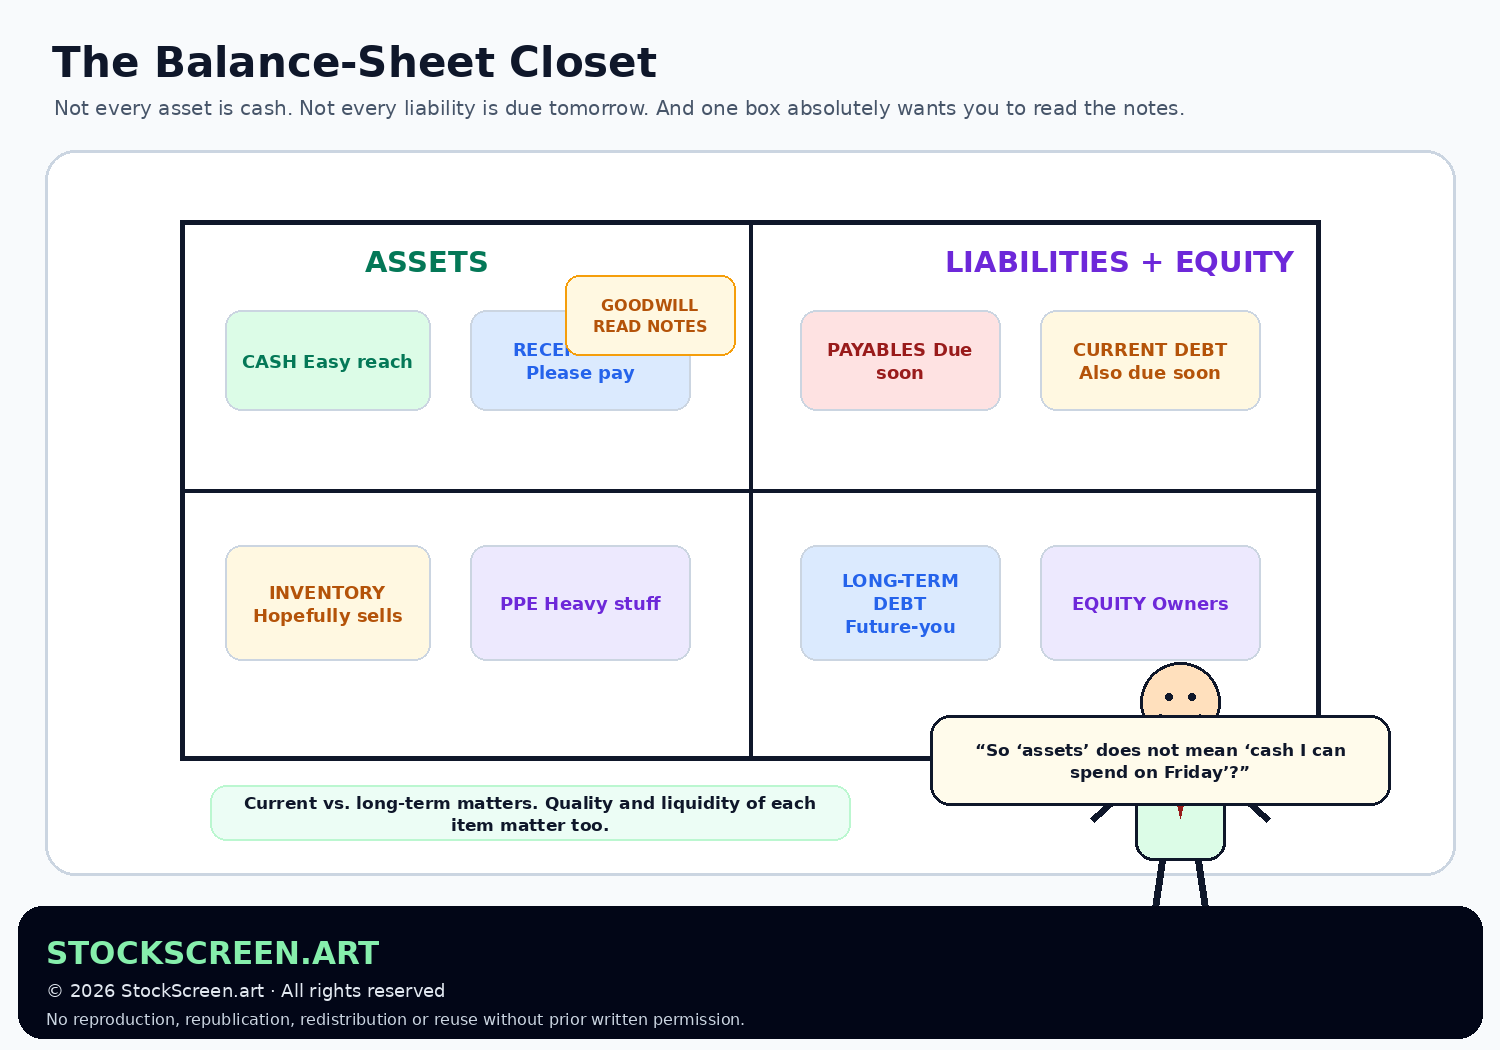
7. Assets: what the company controls
Assets are economic resources controlled by the company.
Common examples include:
- cash and cash equivalents;
- marketable securities;
- accounts receivable;
- inventory;
- property, plant and equipment;
- acquired intangible assets;
- goodwill;
- other investments and long-term assets.
But please do not mentally replace:
“$1 billion of assets”
with:
“$1 billion of cash in a cheerful vault.”
Assets have different levels of liquidity, usefulness, uncertainty and economic value.
8. Current assets: resources expected to turn over sooner
The balance sheet commonly separates current assets from longer-term assets.
Current assets generally include items expected to be converted to cash, sold or consumed within the operating cycle or roughly one year, depending on the accounting framework and circumstances.
Common current assets include:
- cash;
- short-term investments;
- accounts receivable;
- inventory;
- prepaid expenses.
Notice that not all current assets are equally liquid.
Cash is already cash.
Receivables need customers to pay.
Inventory needs somebody to buy it.
A warehouse full of last year's fashionable phone cases may technically be an asset.
It may also be a warehouse full of regret.
9. Long-term assets: productive capacity and acquired value
Longer-term assets can include property, equipment and other resources expected to benefit the company over several years.
A manufacturer may have:
- factories;
- machinery;
- warehouses;
- land.
A technology company may have fewer physical assets and more:
- software-related assets;
- acquired technology;
- customer relationships;
- goodwill from acquisitions.
10. Goodwill: the box that says “read the notes”
Goodwill often appears when one company acquires another for more than the accounting value of the identifiable net assets acquired.
It can reflect things such as:
- expected synergies;
- assembled workforce;
- business reputation;
- other value not separately recognized as an identifiable asset.
Goodwill is a legitimate accounting asset.
It is not cash.
It is not a building you can sell room by room.
And if an acquisition performs poorly, goodwill may later be impaired.
11. Liabilities: what the company owes
Liabilities are obligations owed to other parties.
Common examples include:
- accounts payable;
- accrued expenses;
- short-term borrowings;
- long-term debt;
- lease obligations;
- tax liabilities;
- other contractual obligations.
Debt is one type of liability.
Not every liability is debt.
If a company owes a supplier for inventory already delivered, that payable is a liability even though nobody issued a corporate bond to buy the cardboard boxes.
12. Current liabilities: the near-term claims
Current liabilities generally represent obligations expected to be settled within the operating cycle or roughly one year.
Examples may include:
- accounts payable;
- accrued payroll;
- taxes payable;
- current portions of long-term debt;
- short-term borrowing.
Investors often compare current assets with current liabilities to think about near-term financial flexibility.
13. Working capital: the short-term operating cushion
A simple measure is:
Working capital = Current assets − Current liabilities
Suppose a company has:
- Current assets: $80M
- Current liabilities: $55M
Working capital is:
$25M
Positive working capital can indicate a short-term resource cushion.
But interpretation depends heavily on the business.
Some excellent companies operate with low or even negative working capital because customers pay quickly while suppliers are paid later.
Others desperately need inventory and receivables to remain liquid.
Finance continues its long-running campaign against universal shortcuts.
14. Shareholders’ equity: the accounting residual
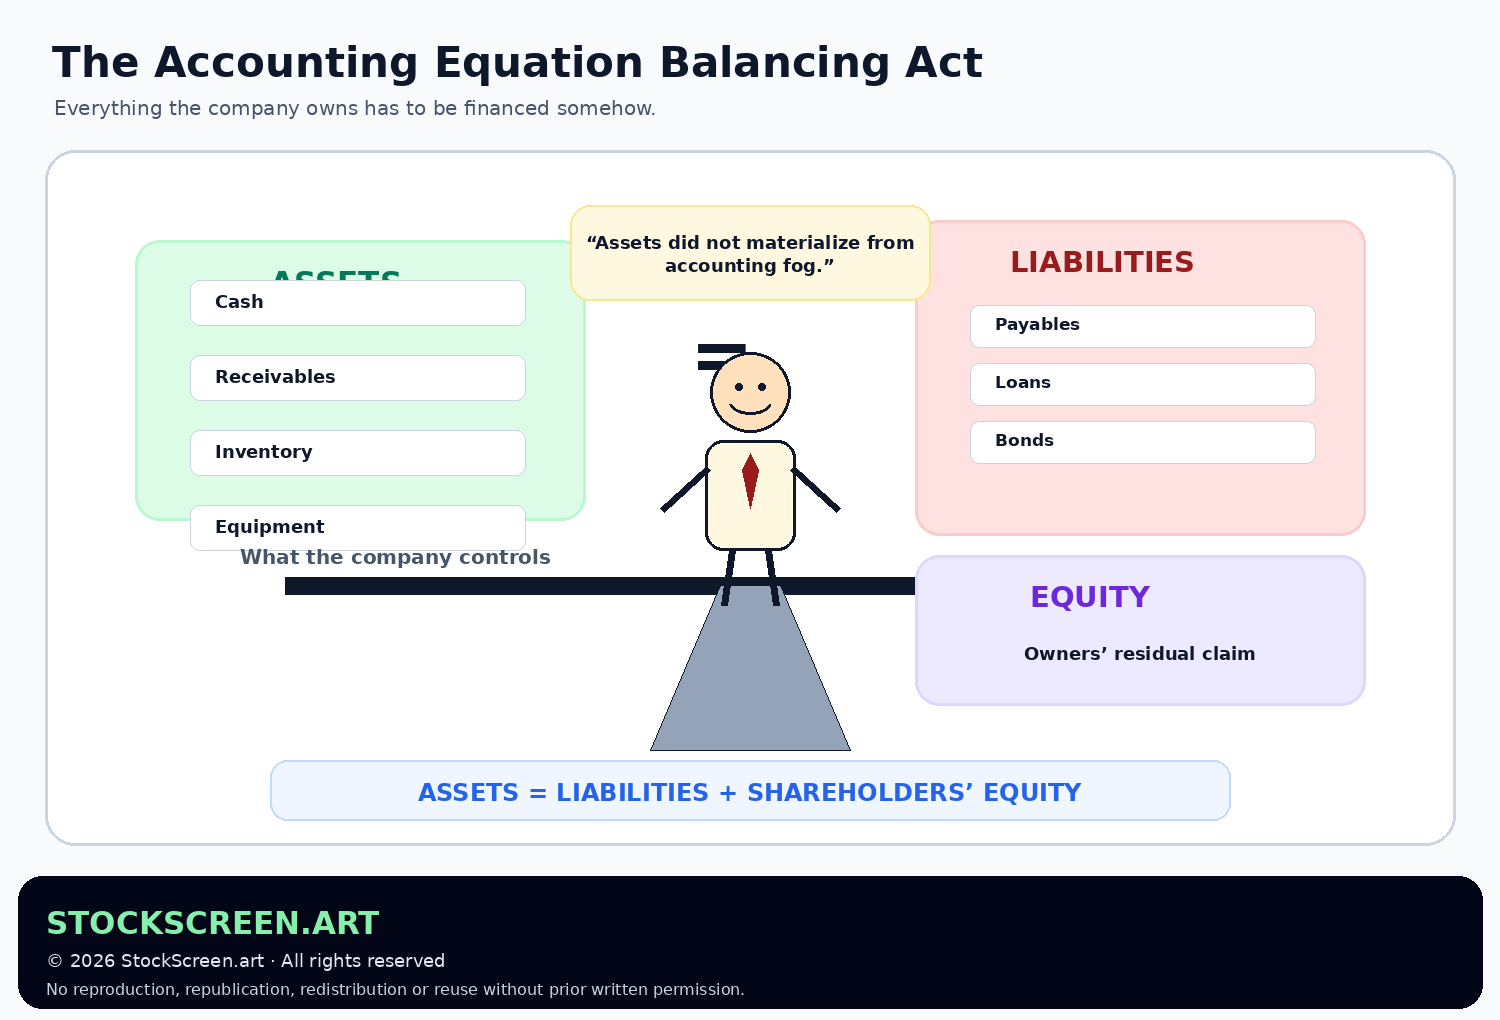
The SEC describes shareholders' equity as the owners' residual interest after liabilities are deducted from assets.
In simplified form:
Shareholders’ Equity = Assets − Liabilities
Which rearranges into the fundamental accounting equation:
Assets = Liabilities + Shareholders’ Equity
Every asset has to be financed somehow.
Either:
- creditors supplied capital;
- owners supplied capital;
- the company retained profits over time;
- or some combination of these.
15. What sits inside shareholders’ equity?
Equity can contain several components.
Depending on the company, these may include:
- common stock at accounting par or stated value;
- additional paid-in capital;
- retained earnings;
- accumulated other comprehensive income or loss;
- treasury stock or other contra-equity items.
We do not need to memorize every label yet.
The most important early concept is retained earnings.
16. Retained earnings connect profit to the balance sheet
Net income belongs to shareholders economically, but companies do not necessarily distribute all of it as dividends.
Profit retained inside the company can accumulate in retained earnings.
A simplified relationship is:
Beginning retained earnings + net income − dividends = ending retained earnings
Real statements may include additional adjustments.
But the concept is powerful:
17. Example: watch the two statements connect
Suppose LampCo begins the year with:
- Assets: $200M
- Liabilities: $120M
- Equity: $80M
During the year:
- LampCo earns $10M of net income.
- It pays $3M of dividends.
Ignoring other equity changes for simplicity, retained earnings increase by approximately $7M.
Equity could therefore rise from $80M to roughly $87M.
The company earned profit in the movie.
Part of that profit now appears in the year-end photograph.
18. Debt changes both the picture and future performance
Suppose LampCo borrows $50M.
Immediately:
- cash, an asset, rises by $50M;
- debt, a liability, rises by $50M.
The accounting equation remains balanced.
In future periods, that debt may also create interest expense on the income statement.
One financing decision therefore affects:
- the balance sheet now;
- the income statement later;
- the cash flow statement as money is borrowed, interest is paid and principal is repaid.
The statements are separate reports.
The business underneath them is one organism.
19. Receivables: one of the first quality checks
Recall from Lesson 1 that revenue can be recognized before the customer's cash arrives.
If receivables rise roughly alongside sales, that may be perfectly normal.
But imagine:
| Year 1 | Year 2 | |
|---|---|---|
| Revenue | $100M | $110M |
| Accounts receivable | $15M | $35M |
Revenue grew 10%.
Receivables more than doubled.
That does not prove aggressive accounting or customer trouble.
It does earn a question:
“Why are customers owing so much more relative to sales?”
20. Inventory: asset today, markdown tomorrow?
Inventory is another useful operating signal.
Growing inventory may mean:
- the company is preparing for higher demand;
- supply chains required earlier purchasing;
- new stores are being stocked;
- products are not selling as quickly as expected.
Context decides which.
If inventory rises sharply while sales slow, investors may worry about future discounts or write-downs.
A warehouse can hold merchandise.
It can also hold evidence.
21. Debt: useful tool, dangerous hobby
Debt is not automatically bad.
Companies borrow to:
- build factories;
- fund acquisitions;
- finance working capital;
- repurchase shares;
- bridge temporary cash needs.
The important questions include:
- How much debt is there?
- When does it mature?
- What interest rate does it carry?
- Is it fixed or floating?
- Can operating cash flow comfortably service it?
- What assets or covenants are attached?
Debt can improve shareholder returns when used productively.
It can also convert a temporary business problem into a meeting with several very serious bankers.
22. Negative shareholders’ equity does not automatically mean bankruptcy
If liabilities exceed accounting assets, shareholders’ equity can become negative.
That deserves investigation.
But it does not automatically mean the company is insolvent or about to disappear.
Negative book equity can arise for different reasons, including:
- accumulated losses;
- large share repurchases;
- accounting write-downs;
- capital structures built around substantial debt;
- business models whose valuable internally developed assets are not fully represented on the balance sheet.
The balance sheet gives you information.
It still requires interpretation.
23. Book equity is not market capitalization
This misconception deserves bold type.
Market capitalization is approximately:
Share price × shares outstanding
Book equity is an accounting measure based on recognized assets, liabilities and accumulated equity transactions.
A company can have:
- $5B of book equity;
- a $50B stock-market value.
Or the reverse.
The market is pricing expected future economics, not merely photocopying the balance sheet and adding a service fee.
24. Assets are not all worth their book value to an investor
Accounting values follow accounting rules.
Economic values can differ.
Land purchased decades ago may be worth more than its carrying value.
Inventory may later require markdowns.
Receivables may not all be collected.
Goodwill may be impaired.
Internally developed brands, networks or intellectual property may have enormous economic value while not appearing on the balance sheet at anything close to a market valuation.
This is why:
“Assets minus liabilities equals intrinsic value”
is generally far too simplistic for an operating company.
25. The notes are part of the financial statements
Investor.gov and the SEC both emphasize the importance of the audited financial statements and accompanying disclosures in Form 10-K.
The notes can explain:
- what is inside major line items;
- debt maturities;
- lease obligations;
- goodwill and intangible assets;
- share-based compensation;
- accounting policies;
- contingencies;
- acquisitions;
- revenue-recognition policies.
If a balance-sheet item is large, unusual or growing quickly, the notes are often where the sentence beginning:
“The increase primarily reflects...”
finally appears.
26. A practical income-statement checklist
- Revenue: Is it growing? What is driving growth?
- Gross margin: Are production economics improving or weakening?
- Operating expenses: Are they scaling efficiently with revenue?
- Operating margin: Is the core business becoming more profitable?
- Interest expense: Is financing becoming a larger burden?
- Net income / EPS: Is per-share profitability improving?
- One-time items: Is one period unusually distorted?
27. A practical balance-sheet checklist
- Cash: How much liquidity does the company actually have?
- Receivables: Are they growing reasonably relative to revenue?
- Inventory: Is it moving with sales or building unexpectedly?
- Current liabilities: Are near-term obligations manageable?
- Debt: How much, what kind, and when does it mature?
- Goodwill/intangibles: How much of the asset base came from acquisitions?
- Equity: Is it changing because of profits, losses, dividends, issuance or buybacks?
28. Why this matters for StockScreen.art
Technical analysis can tell you that the market is rewarding a company.
The income statement can tell you whether operating performance is improving.
The balance sheet can tell you what kind of financial structure is supporting that performance.
Imagine two stocks with equally strong momentum.
Company A:
- growing revenue;
- improving margins;
- ample cash;
- modest debt.
Company B:
- growing revenue;
- falling margins;
- receivables surging;
- debt approaching maturity.
The charts can look similar.
The financial context is not.
A screener helps identify where to look.
Financial statements help determine what you are actually looking at.
29. Eight mental models worth keeping
- Income statement = movie; balance sheet = photograph.
- Revenue and profit happen over a period; assets and liabilities exist at a point in time.
- Assets = liabilities + equity.
- Liquidity depends on the quality of assets, not just their total.
- Debt creates both a balance-sheet obligation and future income-statement interest expense.
- Net income can increase retained earnings and therefore equity.
- Book equity is not market capitalization.
- The notes are not optional decoration.
Quick knowledge check
Nine questions. The balance sheet insists the answers equal the questions plus retained confusion.
1. Does an income statement describe a period or one specific date?
A period of time, such as a quarter or fiscal year.
2. Does a balance sheet describe a period or one specific date?
One specific date — a snapshot of assets, liabilities and shareholders’ equity at that point in time.
3. What is the fundamental accounting equation?
Assets = Liabilities + Shareholders’ Equity.
4. Is accounts receivable the same thing as cash?
No. It represents amounts customers owe the company. Collection still has to occur.
5. Is all debt a current liability?
No. Debt may be short-term or long-term. Portions due within the next operating cycle or roughly one year are commonly classified as current.
6. Can net income affect shareholders’ equity?
Yes. Profit retained in the business can increase retained earnings, although dividends and other equity transactions also affect the ending balance.
7. Does negative shareholders’ equity automatically mean a company is bankrupt?
No. It deserves investigation, but negative book equity can arise for multiple reasons and is not by itself proof of bankruptcy.
8. Is shareholders’ equity on the balance sheet equal to market capitalization?
No. Book equity is an accounting residual; market capitalization is based on the market price of outstanding shares.
9. Why might rapidly growing receivables matter?
They may simply reflect growth, but if receivables rise much faster than revenue they can signal slower customer collections or other changes in revenue quality worth investigating.
Where we go next
We now understand:
- what the business sold;
- what it earned;
- what happened to cash;
- what it owns;
- what it owes.
Next we focus on one of the most useful bridges between accounting profit and economic reality:
FND-VAL-03 — Free Cash Flow.
This is where operating cash flow meets capital spending, and the company discovers that factories, servers and equipment continue refusing to build themselves for free.
Primary sources & further reading
- U.S. Securities and Exchange Commission — Beginner's Guide to Financial Statements
- Investor.gov — How to Read a 10-K
- Investor.gov — How to Read a 10-K/10-Q
- U.S. Securities and Exchange Commission — Financial Reporting Glossary