Last lesson, we learned that five holdings can secretly be one bet wearing five different name tags.
Today we meet the tool that helps expose the group chat:
correlation
Correlation asks:
“When Investment A moves, what does Investment B tend to do?”
Sometimes they move together.
Sometimes they move in opposite directions.
Sometimes they behave like two strangers sharing an elevator: technically in the same place, emotionally unrelated.
1. What correlation measures
Correlation measures the degree to which two variables move together.
In portfolio analysis, we usually care about the correlation between returns.
The most familiar version is the Pearson correlation coefficient.
Its value ranges from:
−1 to +1
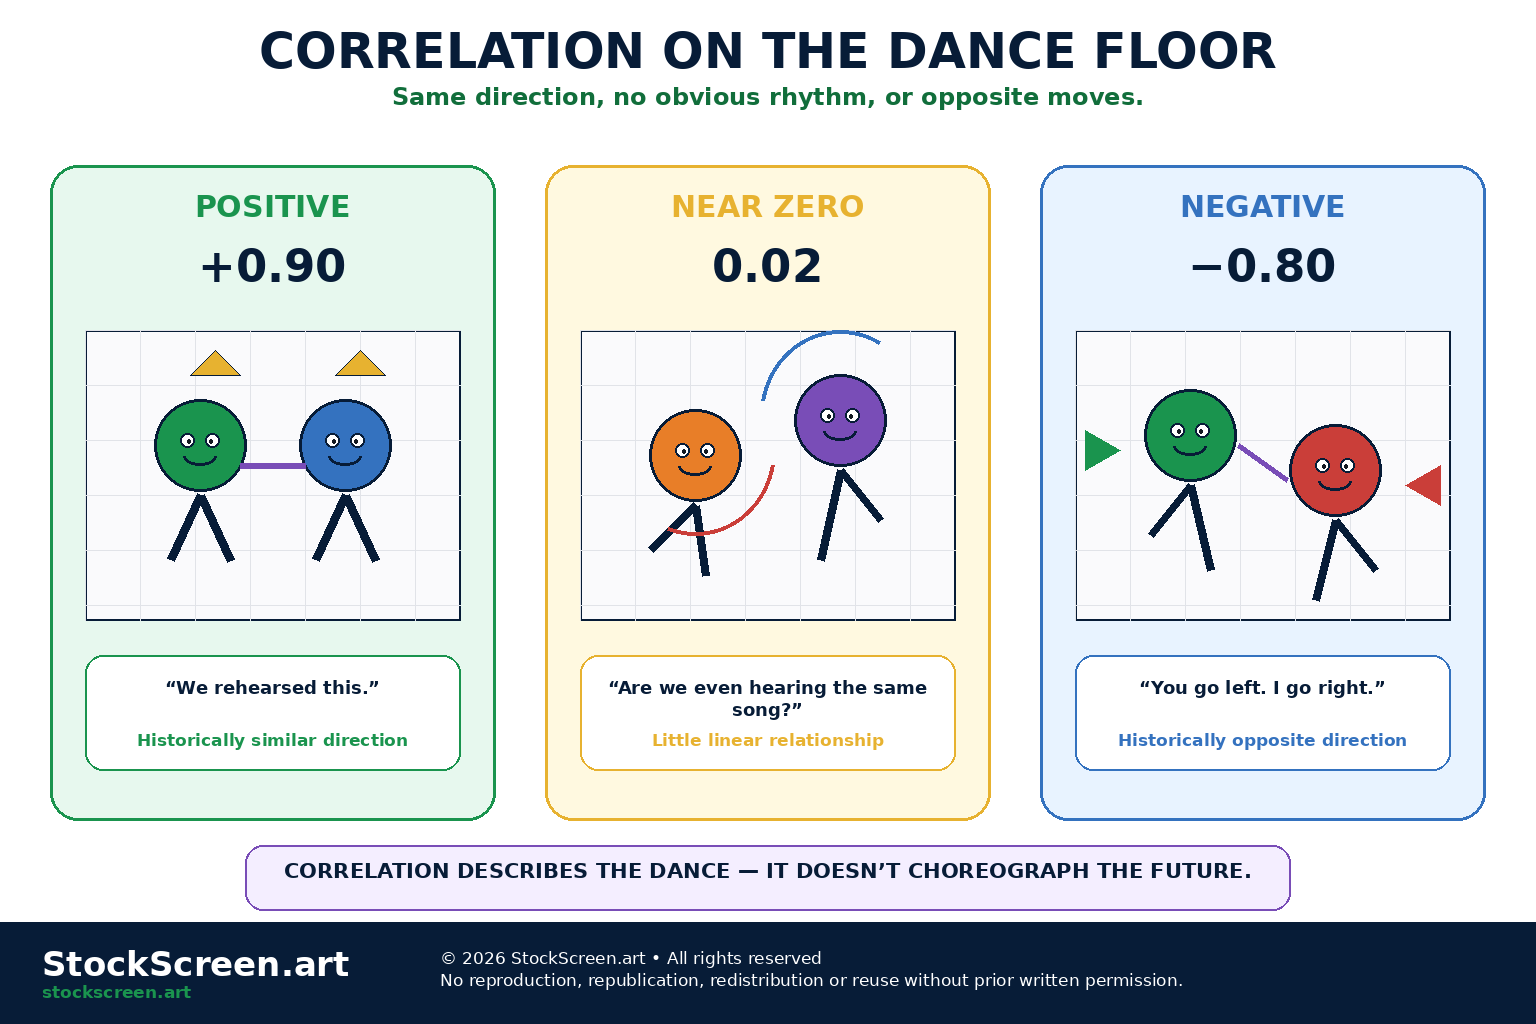
2. Correlation of +1
A correlation of +1 means the two return series have a perfect positive linear relationship.
When one moves higher relative to its average, the other moves proportionally higher too.
In real markets, exact +1 correlations are unusual for distinct securities over long periods.
But correlations can be very high.
3. Correlation near +1
A value such as:
+0.90
indicates a strong positive historical relationship.
The two investments have tended to move in similar directions.
If both are large portfolio positions, they may provide less diversification than their different names suggest.
4. Correlation of 0
A correlation near zero means there is little linear relationship over the sample being measured.
It does not mean:
- the assets never move together;
- the assets are independent;
- the relationship will stay near zero;
- one cannot affect the other through a nonlinear mechanism.
Zero is more modest than it looks.
5. Correlation of -1
A correlation of -1 means a perfect negative linear relationship.
When one return rises relative to its average, the other falls proportionally.
A perfect -1 relationship can theoretically create powerful diversification effects.
Real markets are rarely considerate enough to provide stable perfect opposites.
6. Correlation near -1
A value such as:
-0.70
indicates a strong negative historical relationship.
That can help offset portfolio fluctuations.
But negative correlation can weaken, disappear or reverse.
Do not marry the minus sign.
7. Correlation is based on returns, not price levels
Two assets can both have rising long-term price charts and still have modest return correlation.
That is because correlation usually compares periodic changes:
- daily returns;
- weekly returns;
- monthly returns.
Comparing raw price levels can create misleading relationships.
8. The basic formula
Conceptually, correlation standardizes covariance:
Correlation(X,Y) = Covariance(X,Y) ÷ (Standard Deviation of X × Standard Deviation of Y)
You do not need to calculate this by hand every morning before coffee.
The important idea is that correlation compares shared movement with the amount each series moves on its own.
9. Covariance is the raw co-movement idea
Covariance asks whether two return series tend to be:
- above their averages together;
- below their averages together;
- or on opposite sides of their averages.
Correlation rescales that relationship into the convenient -1 to +1 range.
10. Correlation does not imply causation
If Asset A and Asset B have high correlation, that does not prove A causes B to move.
They may both be reacting to:
- interest rates;
- economic growth;
- oil prices;
- risk appetite;
- industry demand;
- the same benchmark index.
Two umbrellas opening together does not mean one umbrella caused the rain.
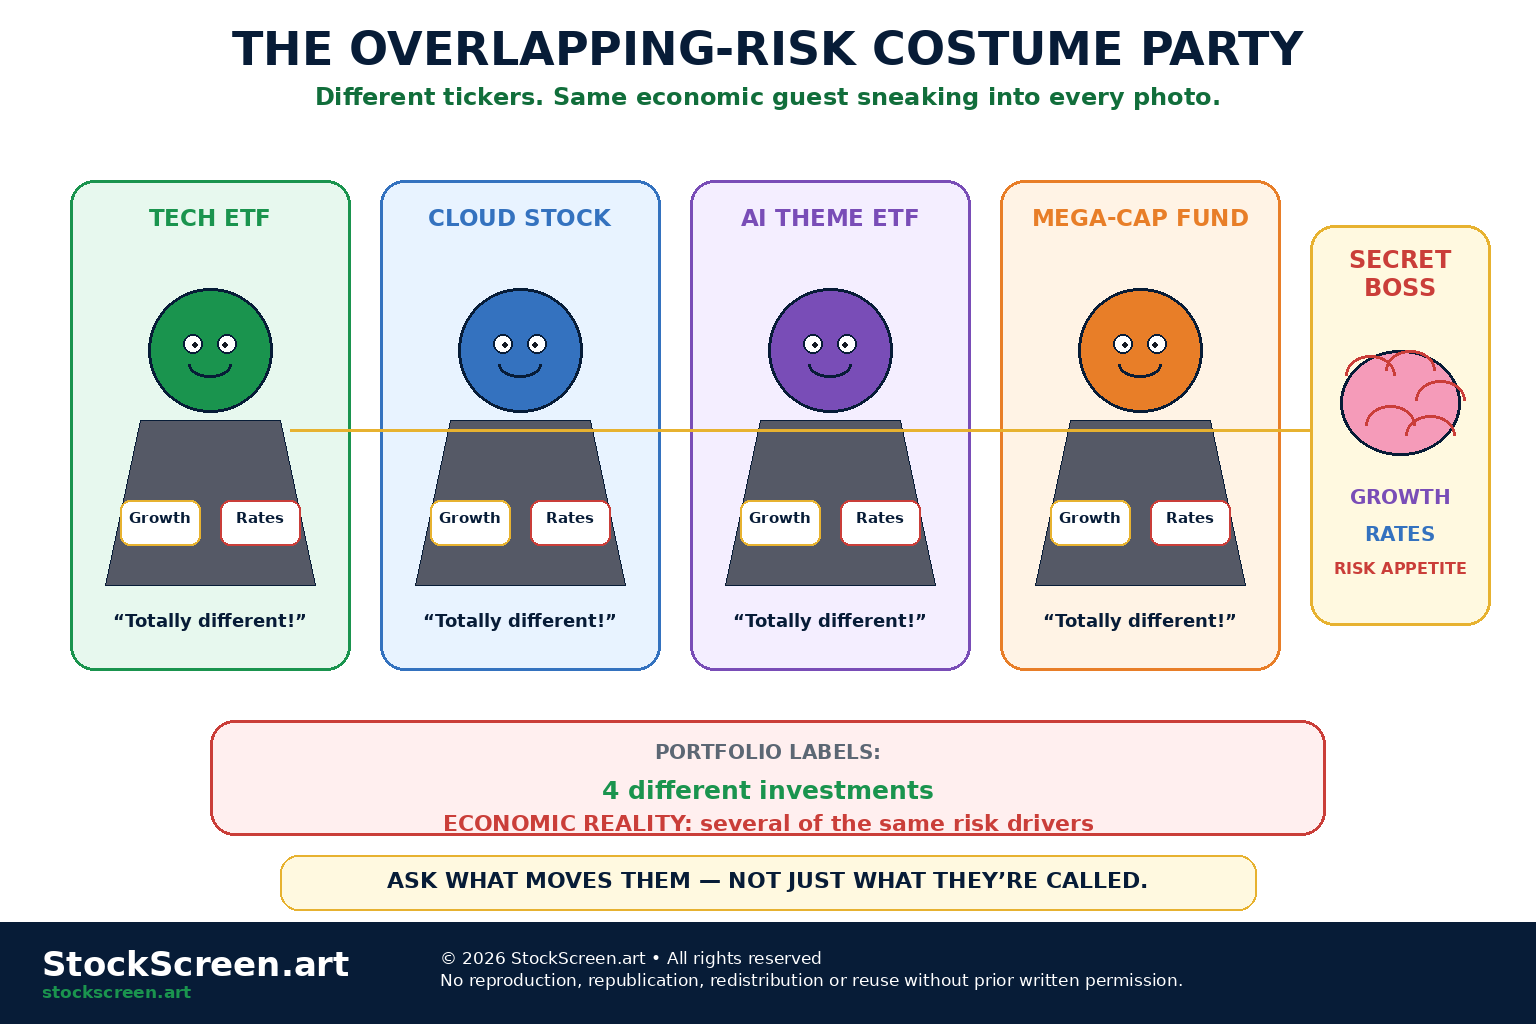
11. Common drivers create overlapping risk
Imagine two companies:
- a semiconductor manufacturer;
- a cloud-computing company.
Different products.
Different industries.
Yet both may respond strongly to:
- growth-stock sentiment;
- interest rates;
- technology capital spending;
- large-index flows.
Economic overlap can exist even when business descriptions differ.
12. Sector overlap
Securities in the same sector often share important drivers.
Banks may respond to:
- interest rates;
- credit losses;
- loan growth;
- financial regulation.
Energy producers may respond to:
- oil and gas prices;
- production costs;
- capital spending;
- geopolitics.
Sector diversification can therefore matter even when each company looks individually attractive.
13. Factor overlap
Securities can also share investment-style or factor exposure.
Examples include:
- growth;
- value;
- momentum;
- quality;
- size;
- low volatility.
A portfolio containing ten “different” growth stocks may still be one large growth-factor bet.
14. Interest-rate overlap
Interest rates can affect many securities through valuation and financing.
A portfolio might contain:
- growth stocks;
- real estate investment trusts;
- long-duration bonds.
Those assets are not identical.
Yet all may be sensitive to changes in yields.
15. Commodity overlap
Several holdings can depend on the same commodity.
Examples:
- oil producers;
- oil-field services companies;
- pipeline operators;
- energy-sector funds.
Four ticker symbols.
One barrel quietly running the meeting.
16. Currency overlap
Multinational companies can share exposure to currency movements.
A stronger or weaker domestic currency can affect:
- translated foreign revenue;
- import costs;
- export competitiveness;
- foreign earnings.
Currency risk can therefore connect companies in different sectors.
17. Benchmark overlap
Large stocks can appear in many indexes.
A portfolio might own:
- a broad-market ETF;
- a large-cap growth ETF;
- a technology ETF;
- several individual index heavyweights.
Each line item looks distinct.
Underneath, the same companies may keep waving at you.
18. Holdings overlap versus return correlation
These are related concepts, but not the same.
Holdings overlap
Two funds literally own some of the same securities.
Return correlation
Two investments have historically produced return patterns that move together.
Funds can have low direct holdings overlap and still have high return correlation if they react to the same forces.
19. A correlation matrix
A correlation matrix displays pairwise correlations among multiple investments.
Fictional example:
| Tech ETF | Growth ETF | Bond ETF | Gold Fund | |
|---|---|---|---|---|
| Tech ETF | 1.00 | 0.88 | -0.15 | 0.08 |
| Growth ETF | 0.88 | 1.00 | -0.10 | 0.05 |
| Bond ETF | -0.15 | -0.10 | 1.00 | 0.20 |
| Gold Fund | 0.08 | 0.05 | 0.20 | 1.00 |
The matrix helps reveal clusters.
In this fictional example, Tech and Growth are the couple who arrived wearing matching jackets.
20. Why the diagonal is 1.00
Every asset is perfectly correlated with itself.
Therefore the diagonal of a standard correlation matrix is:
1.00
This is the easiest finance fact you will learn all week.
21. The matrix is symmetric
Correlation between A and B is the same as correlation between B and A.
Therefore a correlation matrix mirrors itself across the diagonal.
Half the table is basically the other half wearing a fake moustache.
22. Clusters matter more than isolated numbers
A portfolio can contain groups of holdings with high internal correlation.
For example:
- a technology cluster;
- a bank cluster;
- a bond cluster;
- a commodity cluster.
The portfolio may look diversified at the ticker level but be concentrated in a few large clusters.
23. Correlation depends on the measurement period
A correlation calculated using the last:
- 30 days;
- 1 year;
- 5 years;
can produce different results.
Relationships change.
The sample window matters.
24. Return frequency matters too
Daily, weekly and monthly returns can produce different correlation estimates.
Why?
Because short-term noise, delayed reactions and longer economic cycles appear differently at different frequencies.
Correlation has settings.
It is not one divine number delivered on stone tablets.
25. Rolling correlation
A rolling correlation calculates correlation repeatedly using a moving time window.
For example:
- 60 trading days ending today;
- then 60 trading days ending tomorrow;
- then the next window;
- and so on.
This helps show whether the relationship is stable or changing.
26. Correlations can change sign
Two assets can move from:
- positive correlation;
- to near zero;
- to negative correlation;
across different regimes.
Any diversification plan that assumes one historical sign lasts forever deserves supervision.
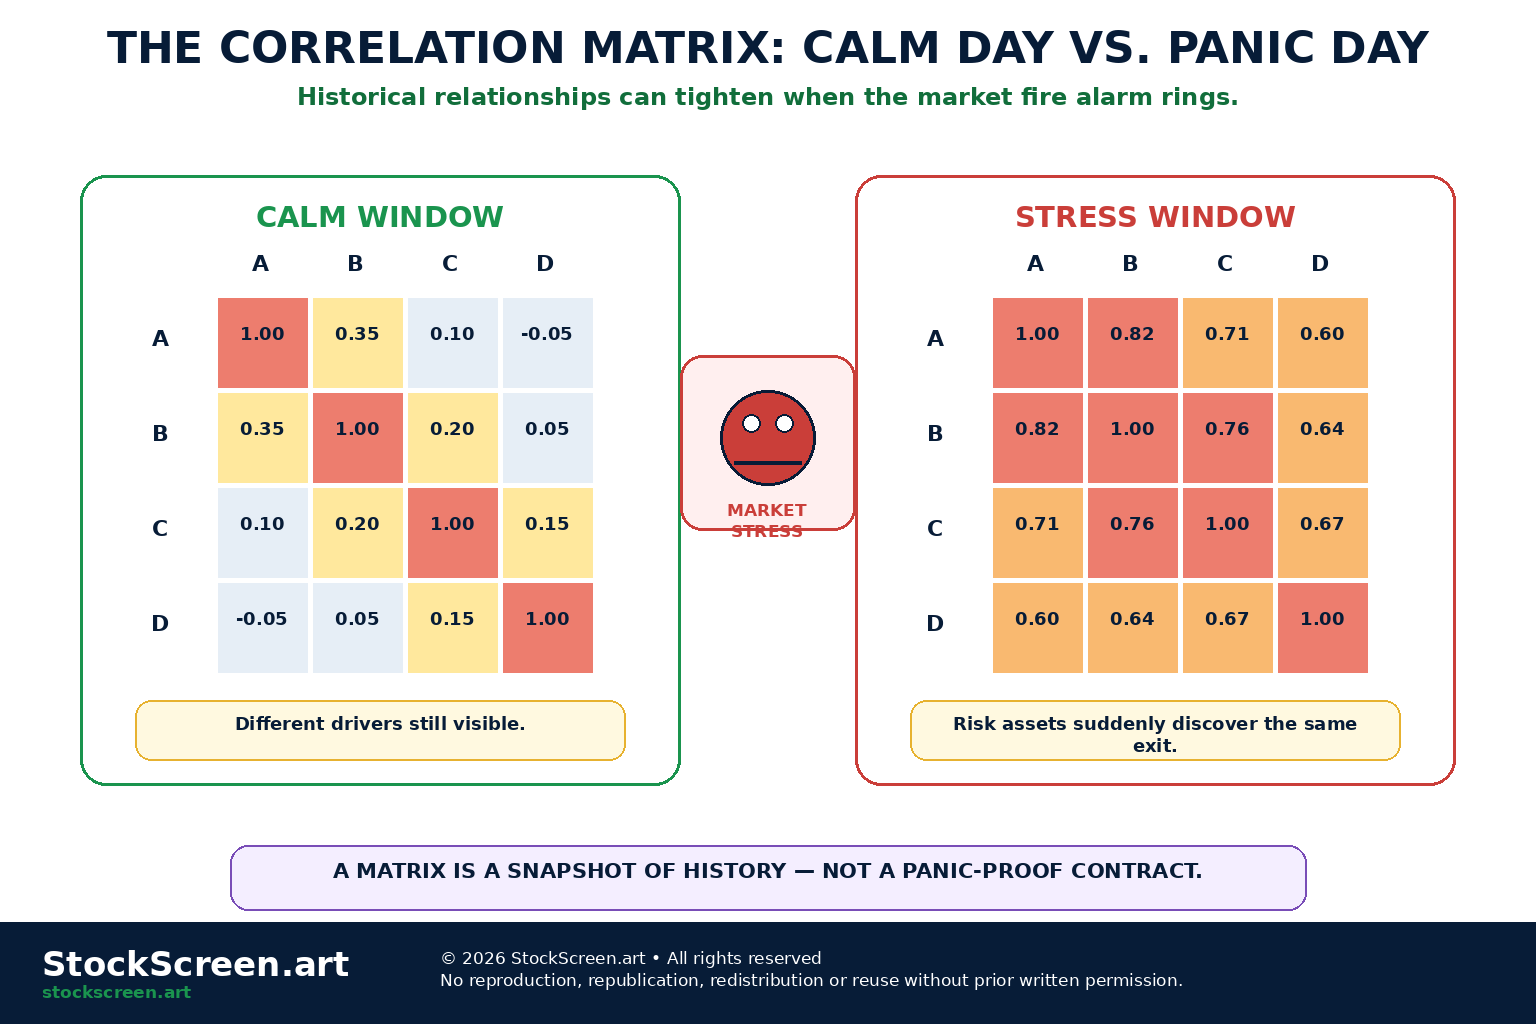
27. Stress can increase correlation
During severe market stress, investors may sell many risky assets simultaneously.
That can cause assets that looked only moderately related during calm periods to move more closely together.
Liquidity needs can overpower differences that seemed important in normal markets.
28. “Everything went down” does not prove correlation is always high
One bad week is not enough to define the long-run relationship.
Correlation is estimated over a sample.
A common shock can temporarily dominate all other drivers.
Do not confuse:
“these assets fell together today”
with:
“these assets are permanently highly correlated”
29. Correlation is not the same as beta
Correlation measures the strength of co-movement.
Beta measures sensitivity to movements in a benchmark.
Two investments can have:
- high correlation with the market;
- but different beta magnitudes.
One may move in the same direction but much more dramatically.
30. Correlation is not the same as volatility
Volatility describes how much an investment fluctuates.
Correlation describes how those fluctuations line up with another investment.
A low-volatility asset and high-volatility asset can still be highly correlated.
Different volume knobs.
Same song.
31. Correlation only describes linear relationship
Pearson correlation summarizes linear co-movement.
Some relationships are nonlinear.
For example, Asset B might respond little to Asset A during ordinary conditions but react strongly after Asset A crosses a threshold.
A single correlation coefficient can miss that structure.
32. Tail dependence
Investors care especially about what happens during extreme losses.
Two assets can have modest average correlation but still suffer large losses together during crises.
This is one reason risk analysis should not stop at one average historical correlation.
33. Regimes change relationships
Market regimes can change when:
- inflation changes;
- interest rates change;
- growth accelerates or contracts;
- liquidity conditions change;
- policy changes;
- investor positioning changes.
The stock-bond relationship, for example, can behave differently in different inflation and rate environments.
Historical relationships are evidence.
They are not marriage vows.
34. Common ownership can create common behavior
Securities may also move together because they are owned by the same types of investors or appear in the same portfolios.
When those investors reduce risk, multiple holdings can be sold together.
Portfolio construction and market structure can therefore influence correlation.
35. Index membership can create shared flows
If several securities are large components of major indexes, index-linked inflows and outflows can affect them together.
This does not erase company fundamentals.
It adds another shared force.
36. Leverage can create forced co-movement
Leveraged investors facing margin pressure may sell whatever is liquid, not necessarily what caused the original problem.
That can temporarily link assets that normally trade on different fundamentals.
When the fire alarm rings, everyone discovers the same staircase.
37. Correlation and diversification
Diversification benefits generally improve when portfolio components do not move perfectly together.
That does not mean every holding needs negative correlation.
Even imperfectly positive correlations can provide diversification compared with owning only one security.
The goal is not to hunt mystical -1 assets.
The goal is to avoid pretending +0.95 is “basically unrelated.”
38. Pairwise correlation is not a complete portfolio model
A portfolio with many assets contains many pairwise relationships.
Looking at only one pair can miss:
- clusters;
- factor exposure;
- concentration by weight;
- liquidity risk;
- nonlinear positions;
- leverage.
Correlation is one lens.
Portfolios require several.
39. Options can complicate correlation
An option's exposure changes as its Greeks change.
A call option on a stock may not behave like a constant fraction of the stock.
Delta changes.
Time passes.
Implied volatility changes.
Correlation measured on option returns can therefore reflect a changing payoff structure.
40. Hedging instruments can create intentional negative exposure
Some investors deliberately add positions designed to offset part of another risk.
Examples can include:
- index hedges;
- currency hedges;
- duration hedges;
- commodity hedges.
The hedge's usefulness depends on how closely it actually tracks the risk being hedged.
A hedge with poor relationship to the target is just another position wearing a cape.
41. A practical correlation audit
For each major holding, ask:
- What does it actually own or represent?
- What sector or industry drives it?
- What macro variables matter most?
- Does it overlap directly with another holding?
- How correlated have the returns been?
- Was that relationship stable through time?
- What happened during stress periods?
- Would several positions react to the same shock?
42. A practical matrix workflow
A beginner-friendly process:
- Collect consistent return data for the holdings.
- Use the same date range.
- Use the same return frequency.
- Calculate the matrix.
- Look for clusters of high positive correlation.
- Compare calm and stressed periods.
- Check actual holdings overlap separately.
- Ask whether the observed relationship has an economic explanation.
43. Eight terrible correlation conclusions
- “The correlation is 0.22, therefore these assets are independent forever.”
- “They fell together today, so correlation must be 1.00.”
- “Correlation proves causation.”
- “I calculated five years, so the next five years are solved.”
- “Two ETFs have different names, so overlap is impossible.”
- “The matrix says low correlation, so liquidity risk can be ignored.”
- “Negative correlation means one holding always profits when the other loses.”
- “I have a spreadsheet. Therefore uncertainty has been defeated.”
44. Ten mental models worth keeping
- Correlation measures co-movement, not causation.
- +1 moves together; -1 moves opposite; 0 means little linear relationship in the sample.
- Correlation belongs to a time period and frequency.
- Relationships change through regimes.
- Holdings overlap and return correlation are different questions.
- Different tickers can share the same economic driver.
- Stress can make risky assets move together more closely.
- Correlation does not describe volatility magnitude.
- A matrix reveals clusters better than isolated pairwise guesses.
- The best explanation combines statistics with economic reasoning.
Quick knowledge check
Ten questions. The correlation between quiz confidence and actual score remains under investigation.
1. What does a correlation near +1 mean?
The two return series have historically shown a strong positive linear relationship over the measured sample.
2. Does a correlation near zero mean the assets are completely independent?
No. It means little linear relationship was measured over that sample. Nonlinear relationships or changing relationships can still exist.
3. What does negative correlation mean?
The return series have tended to move in opposite directions relative to their averages.
4. Does high correlation prove one asset causes the other to move?
No. Both may respond to common underlying drivers.
5. What is holdings overlap?
When two funds or portfolio positions directly own some of the same underlying securities.
6. Can two funds have little direct holdings overlap but still be highly correlated?
Yes. They may respond to the same economic factors, styles, sectors or macro shocks.
7. Why might correlations rise during severe market stress?
Common shocks, risk reduction, margin pressure and liquidity needs can cause many risky assets to be sold at the same time.
8. Why does the time window matter?
Correlation is estimated from a sample, and relationships can change across different periods and market regimes.
9. What does the diagonal of a standard correlation matrix contain?
1.00 values because each return series is perfectly correlated with itself.
10. What is the best use of correlation in a portfolio?
As one tool for identifying co-movement and overlapping risk, combined with holdings analysis, weights, economic drivers, volatility, liquidity and other risk measures.
Where we go next
Correlation tells us which positions may decide to misbehave together.
The next question is:
“Fine. How large should each position be?”
That takes us to:
FND-PR-03 — Position Sizing.
Because a wonderful idea at an absurd size can still become a very educational mistake.
Primary sources & further reading
- Investor.gov — Beginner's Guide to Asset Allocation, Diversification and Rebalancing
- Investor.gov — Diversify Your Investments
- FINRA — Asset Allocation and Diversification
- FINRA — Concentrate on Concentration Risk
- CFA Institute — Portfolio Risk and Return: Part I
- CFA Institute — Portfolio Risk and Return: Part II