Most brokerage screens show you one large number.
$50.00.
It looks wonderfully authoritative.
You might reasonably assume this means: “The stock costs fifty dollars.”
Not quite.
Behind that tidy number is an ongoing negotiation between buyers and sellers. One group is saying:
“I’ll buy it — but not for that much.”
The other is replying:
“I’ll sell it — but certainly not for what you are offering.”
Somewhere between them sits the market, waiting for somebody to become slightly less stubborn.
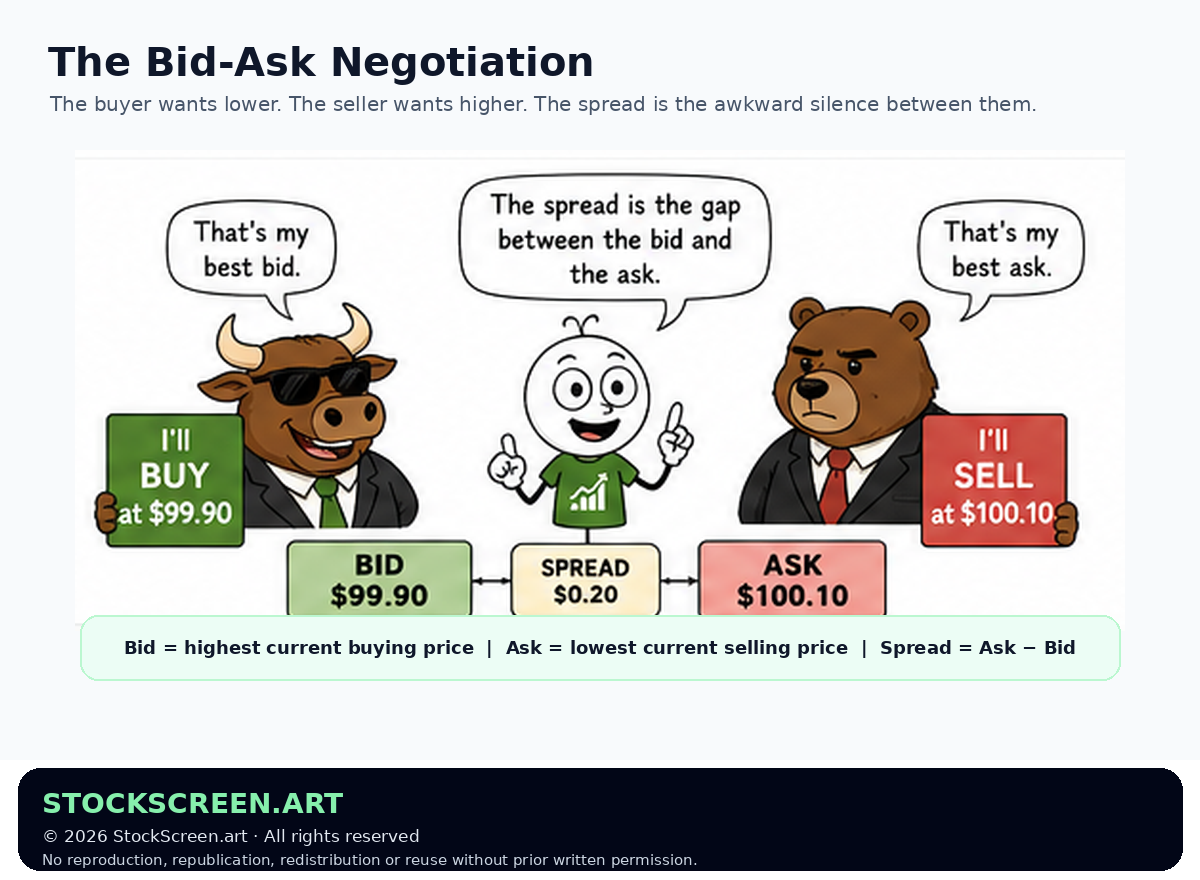
1. The bid: what buyers are offering
Investor.gov defines the bid as the highest price a buyer is currently willing to pay for a specified number of shares.
Suppose fictional XYZ has a best bid of:
$49.95 for 500 shares
That means the strongest displayed buying interest at that moment is willing to buy up to that displayed quantity at $49.95.
It does not mean every buyer in the market agrees XYZ is worth $49.95.
Other buyers may be waiting lower:
- 300 shares at $49.94;
- 800 shares at $49.92;
- 1,000 shares at $49.90;
- one extremely optimistic person at $37.12 who has clearly decided patience is a strategy.
The highest current buying price is simply the best bid.
2. The ask: what sellers want
The ask, also called the offer, is the lowest current price at which a seller is willing to sell.
Suppose XYZ's best ask is:
$50.05 for 400 shares
Sellers may also be waiting above that:
- 700 shares at $50.06;
- 600 shares at $50.08;
- 1,200 shares at $50.10.
The lowest of those displayed selling prices is the best ask.
Ask: lowest current selling price.
Trade: happens when compatible buying and selling interest meets.
3. The spread: the market's little toll booth
If the bid is $49.95 and the ask is $50.05, the bid-ask spread is:
$50.05 − $49.95 = $0.10
Investor.gov defines the spread as the difference between the bid and ask prices.
The spread is important because it creates trading friction.
If you immediately buy at the ask and then immediately turn around and sell at the bid, you can lose money even if the underlying market has not meaningfully changed.
In this example:
- Buy 100 shares at $50.05 = $5,005
- Immediately sell 100 shares at $49.95 = $4,995
- Difference = $10, before considering any other costs or price changes
Investor.gov explicitly describes the bid-ask spread as a trading cost in its ETF education material.
This is one reason a stock that looks inexpensive by share price can still be expensive to trade.
A $3 stock with a 20-cent spread is not necessarily a bargain. It may simply be standing near the register with a hidden surcharge and excellent posture.
4. Why spreads are sometimes tiny and sometimes enormous
Spreads are not fixed.
They can change throughout the day and may widen or tighten depending on market conditions.
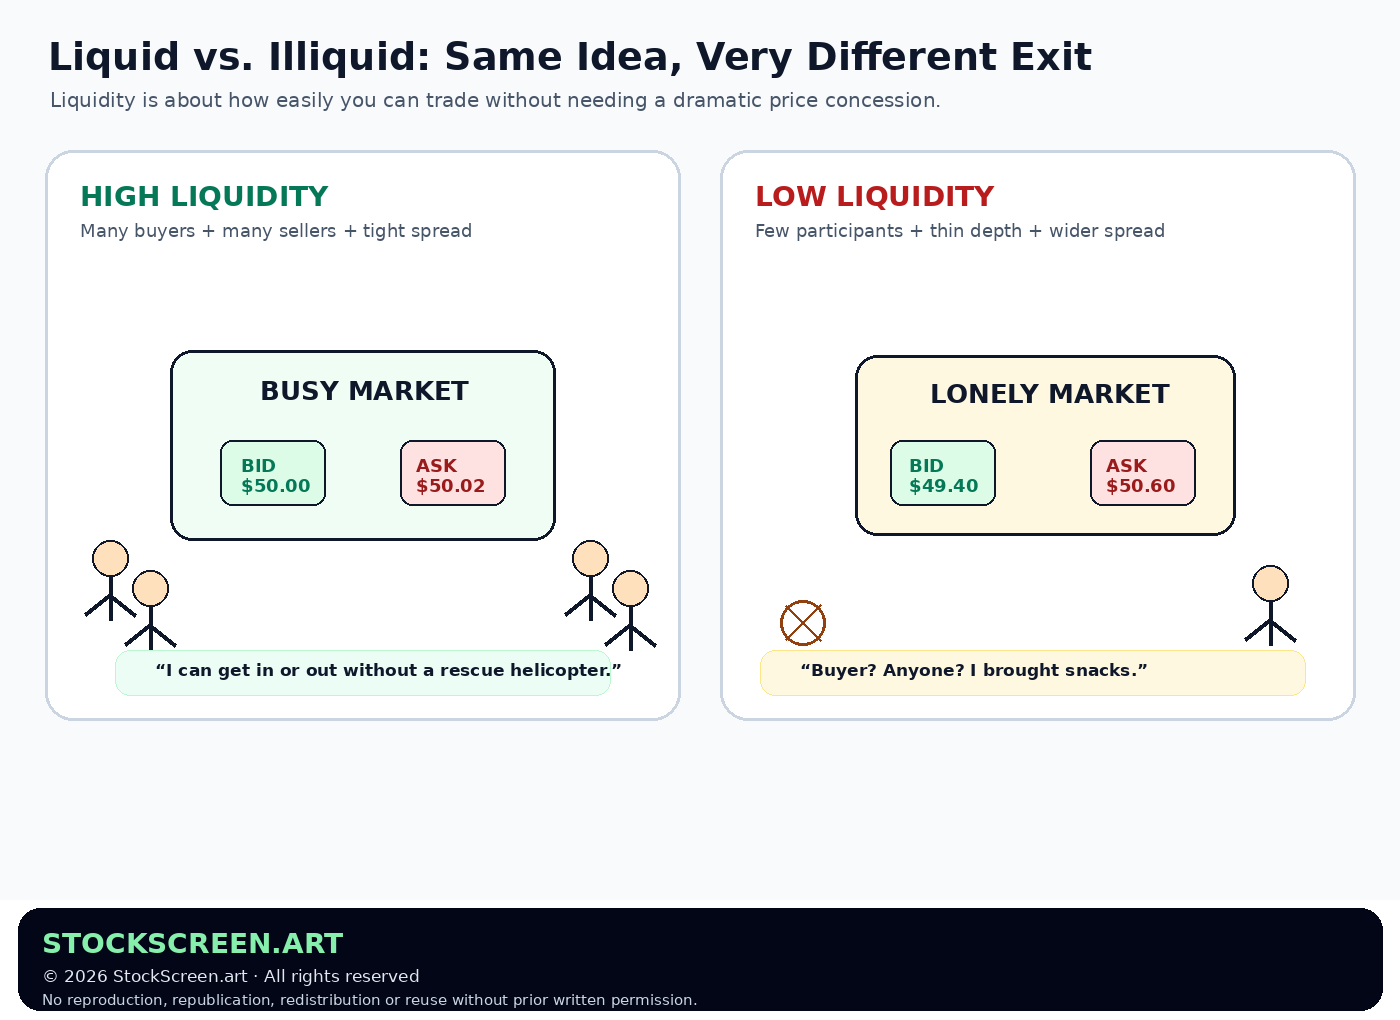
Securities with many active buyers and sellers often have tighter spreads because there is more competition around the current price.
Securities with fewer participants, less trading interest or greater uncertainty may have wider spreads.
That leads directly to our next concept.
5. Liquidity: how easy is the exit?
Investor.gov defines liquidity generally as how easily or quickly a security can be bought or sold in a secondary market.
A liquid security typically has enough active trading interest that investors can buy or sell without needing a large price concession.
An illiquid security may force you to choose between:
- waiting longer;
- accepting a worse price;
- trading in smaller pieces;
- or staring at the screen and developing a personal relationship with the refresh button.
6. Liquidity has more than one dimension
Investors sometimes reduce liquidity to trading volume.
Volume matters, but it is not the whole story.
Useful things to think about include:
Trading activity
More frequent trading often means more participants are available on both sides of the market.
Spread width
A tight spread often signals stronger competition between buyers and sellers.
Available quantity
A market can display an attractive best ask but only have a small number of shares available there.
Depth
Market depth refers to how much buying and selling interest exists at different price levels. A deeper market can often absorb larger orders with less price movement.
Market conditions
Liquidity can change rapidly during major news, market stress, the open, the close, or extended-hours trading.
7. The quote has a quantity attached to it
This is where many new investors get surprised.
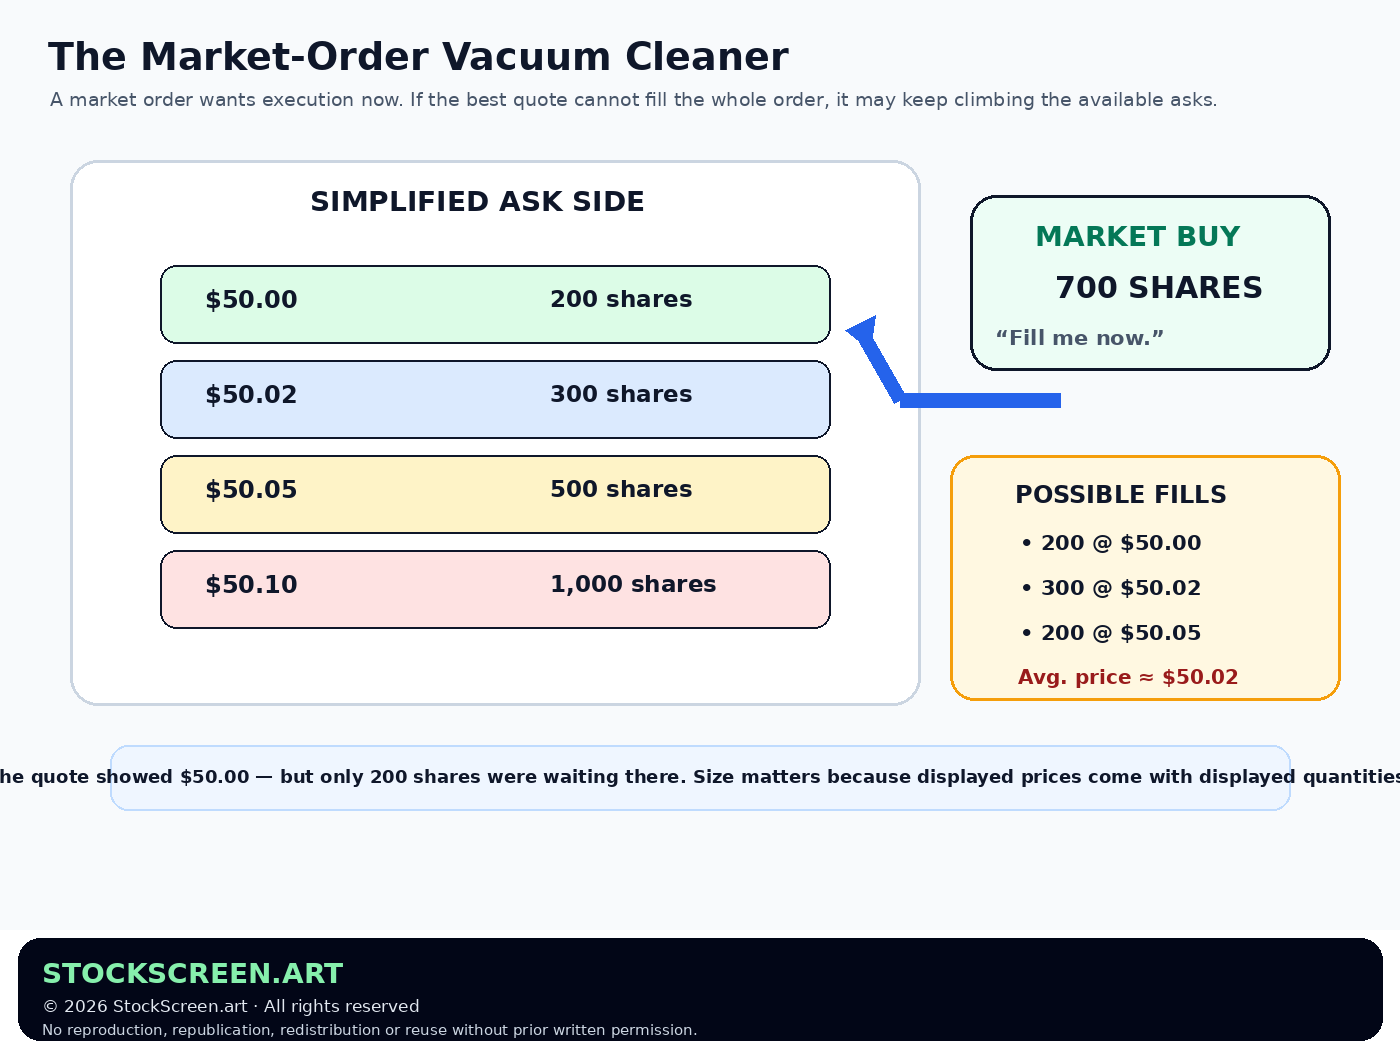
Imagine the best ask says:
$50.00
You want to buy 700 shares.
But suppose only 200 shares are currently available at $50.00.
The next sellers are offering:
- 300 shares at $50.02;
- 500 shares at $50.05;
- 1,000 shares at $50.10.
If you submit a market order for all 700 shares and the available quotes remain unchanged long enough to fill it, the order could potentially trade across several levels:
- 200 shares at $50.00;
- 300 shares at $50.02;
- 200 shares at $50.05.
Your average execution price would therefore be above the original $50.00 best ask.
This is why seeing a price is not the same thing as being guaranteed unlimited quantity at that price.
8. Why the last traded price can fool you
The large number on a quote screen is often the last traded price.
That number tells you where the most recent transaction occurred.
It does not necessarily tell you where you can buy or sell right now.
Investor.gov specifically warns that the last-traded price is not necessarily the price at which a market order will execute.
Suppose the last trade was $50.00, but the current quote is:
- Bid: $49.70
- Ask: $50.30
If you enter a market buy order, your relevant side is the ask — not the historic $50.00 print.
If you enter a market sell order, your relevant side is the bid.
Bid/ask = where current buying and selling interest is showing now.
9. Market orders: execution first, price second
Investor.gov explains that a market order is an instruction to buy or sell immediately.
The advantage is execution priority.
The trade-off is that the execution price is not guaranteed.
In fast-moving markets, or when an order is large relative to available liquidity, portions of a market order can execute at different prices.
This does not mean the market cheated you.
It means you asked:
“Please buy this now at the best prices currently available.”
The market replied:
“Certainly. Here are the prices currently available.”
Whether those are prices you like is a separate matter.
10. Limit orders: price control, but no guarantee of a fill
A limit order lets you specify the highest price you are willing to pay when buying, or the lowest price you are willing to accept when selling.
For example:
Buy XYZ at $50.00 or lower.
This gives you more price control.
But Investor.gov notes the trade-off: a limit order may not execute if the market never reaches your limit or if there is insufficient available quantity ahead of you.
We will cover market orders and limit orders properly in the next Foundation lesson.
For now, the essential difference is:
Limit order: prioritize price control.
11. Why liquidity matters to StockScreen.art users
StockScreen.art's screening process already pays attention to liquidity-related characteristics such as trading volume and dollar volume.
There is a practical reason.
A technically attractive chart can become much less attractive if:
- the spread is unusually wide;
- available size is tiny;
- your intended order is large relative to normal trading activity;
- the stock moves sharply when relatively small orders arrive.
Technical analysis can identify an interesting setup.
Liquidity helps answer:
“Can I realistically trade this thing without the execution becoming part of the problem?”
12. A spread percentage is sometimes more useful than pennies
Compare two securities:
| Security | Bid | Ask | Spread | Approx. spread as % of midpoint |
|---|---|---|---|---|
| Stock A | $100.00 | $100.02 | $0.02 | ~0.02% |
| Stock B | $2.90 | $3.10 | $0.20 | ~6.67% |
Twenty cents does not sound terrifying.
But on a $3 stock, it can represent a very large percentage of the security's value.
This is why low share price and low trading cost are not synonyms.
13. When liquidity can get worse
Spreads and available depth can deteriorate when uncertainty rises.
Examples can include:
- major company news;
- earnings announcements;
- broad market stress;
- trading halts or reopenings;
- very early or very late trading;
- extended-hours sessions;
- securities that are already thinly traded.
A market that looked calm five minutes ago can become much thinner when everyone suddenly wants the same exit.
Markets are wonderfully efficient right up until the fire alarm goes off and everybody remembers there is only one door.
14. Five practical habits
- Look at the bid and ask, not just the last price.
- Notice the spread in percentage terms, especially for low-priced securities.
- Think about your order size relative to normal trading activity.
- Do not assume the displayed best price has unlimited shares available.
- Understand the trade-off between immediate execution and price control before selecting an order type.
Quick knowledge check
Six questions. The spread between Question 1 and Question 6 remains extremely liquid.
1. What is the bid?
The highest current price a buyer is willing to pay for a specified quantity.
2. What is the ask?
The lowest current price at which a seller is willing to sell.
3. If the bid is $20.00 and the ask is $20.08, what is the spread?
$0.08.
4. Does a last traded price of $50.00 guarantee you can buy shares at $50.00?
No. The current ask and available quantity may be different from the last traded price.
5. Why might a large market order execute at several prices?
Because there may not be enough quantity available at the best current price to fill the whole order, so remaining shares may execute against other available price levels.
6. What is the main trade-off of a limit order?
It gives price control, but the order may not execute.
Where we go next
You now understand the two sides of a quote and why liquidity matters.
Next we turn to the instruction you actually give your broker: Market Orders vs. Limit Orders.
One says:
“Get me in.”
The other says:
“Get me in — but I have standards.”
Primary sources & further reading
- Investor.gov — Bid Price / Ask Price
- Investor.gov — Glossary: Liquidity (Marketability)
- Investor.gov — Types of Orders
- Investor.gov — Investor Bulletin: Understanding Order Types
- Investor.gov — Executing an Order
- Investor.gov — Updated Investor Bulletin: Exchange-Traded Funds (bid-ask spread example)